Download
1 / 20
210 likes | 372 Views
The FSU-COAPS Coupled Ocean-Atmosphere Model. H. R. Winterbottom and E.P. Chassignet: The Impacts of an Evolving Ocean Boundary Condition on TC Structure and Intensity. The Impacts of an Evolving Ocean Boundary Condition on TC Structure and Intensity.

E N D
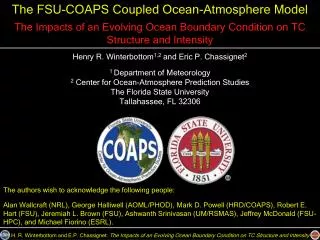
The FSU-COAPS Coupled Ocean-Atmosphere Model H. R. Winterbottom and E.P. Chassignet: The Impacts of an Evolving Ocean Boundary Condition on TC Structure and Intensity The Impacts of an Evolving Ocean Boundary Condition on TC Structure and Intensity Henry R. Winterbottom1,2 and Eric P. Chassignet2 1 Department of Meteorology 2 Center for Ocean-Atmosphere Prediction Studies The Florida State University Tallahassee, FL 32306 The authors wish to acknowledge the following people: Alan Wallcraft (NRL), George Halliwell (AOML/PHOD), Mark D. Powell (HRD/COAPS), Robert E. Hart (FSU), Jeremiah L. Brown (FSU), Ashwanth Srinivasan (UM/RSMAS), Jeffrey McDonald (FSU-HPC), and Michael Fiorino (ESRL).
Introduction Motivation and Scientific Importance H. R. Winterbottom and E.P. Chassignet: The Impacts of an Evolving Ocean Boundary Condition on TC Structure and Intensity The application of NWP modeling to TCs has increased dramatically in recent decades; the skill in track forecasting has improved dramatically on average, while TC intensity forecasting remains difficult (Franklin, 2008) NHC/TPC Mean Track Error (km) NHC/TPC Mean Intensity Error (kts) ? Image derived from http://www.nhc.noaa.gov/verification/verify5.shtml Legend 12-h 24-h 36-h 48-h 72-h 96-h 120-h
Introduction Motivation and Scientific Importance H. R. Winterbottom and E.P. Chassignet: The Impacts of an Evolving Ocean Boundary Condition on TC Structure and Intensity Several hypotheses have been proposed, as they pertain to NWP, for the inability to forecast TC intensity with any reasonable skill: 1. NWP models without an evolving ocean boundary condition, and subsequently forced by a TC, are subject to incorrect atmosphere-ocean interactions and feedbacks (Price, 1981; Price, 1983; Emanuel, 1986; Shay et al., 1992; Shay et al., 2000) TC Bertha (2008) Uncoupled Coupled Surface Latent Heat Flux (W/m2)
Introduction Motivation and Scientific Importance Legend: 30.0-km 8.81-km H. R. Winterbottom and E.P. Chassignet: The Impacts of an Evolving Ocean Boundary Condition on TC Structure and Intensity Several hypotheses have been proposed, as they pertain to NWP, for the inability to forecast TC intensity with any reasonable skill: 2. There is insufficient application of both high-resolution grid-length resolutions and in-situ wind observations for the initial conditions supplied to the NWP model (Anthes, 1974; Kurihara et al., 1993; Serrano and Unden, 1994; Kurihara et al., 1995) Minimum Sea-Level Pressure (hPa) Maximum Wind Speed (kts) TS CAT 2 TC Ike (2008) TC Ike (2008)
Introduction Motivation and Scientific Importance TC Frances (2004) 04 September 1800 Z NCEP FNL H*WIND H. R. Winterbottom and E.P. Chassignet: The Impacts of an Evolving Ocean Boundary Condition on TC Structure and Intensity Several hypotheses have been proposed, as they pertain to NWP, for the inability to forecast TC intensity with any reasonable skill: 3. The TC initial vortex must be positioned correctly and of accurate intensity, while also physically balanced relative to the resolution and physics of the atmospheric model The Impact of Initial Conditions • Using improper initial conditions can result in errors related to the position, intensity, and the exchange of energy between the atmosphere and ocean (Mathur, 1991; Kurihara et al., 1993; Bender et al., 1993b; Kurihara et al., 1995; Bender and Ginis, 2000) • The dynamic initialization of the TC vortex will minimize the imbalances related to the model resolution and physical parameterizations (Hoke and Anthes, 1978; Fiorino and Warner, 1981; Kurihara et al., 1993) The respective contributions for each component, to the TC intensity problem, remains unknown!
Coupled Atmosphere-Ocean Model Atmosphere and Ocean Models H. R. Winterbottom and E.P. Chassignet: The Impacts of an Evolving Ocean Boundary Condition on TC Structure and Intensity • Atmosphere model: Weather Research and Forecasting (WRF) Advanced Research WRF (ARW) v 2.2 (Skamarock et al., 2005) • WRF-ARW as demonstrated skill related to the forecasting of TCs: • Davis et al., 2008 – Prediction of Landfalling Hurricanes with the Advanced Hurricane WRF model • Xiao et al., 2008 – Experiments on WRF Hurricane Initialization (WRF-HI) – An Approach Based on WRF Variational Data Assimilation of Remote-Sensing and Synthetic Observations • Wang et al., 2006 – Evaluation of WRF-ARW high resolution tropical storm forecasts in the 2005 season • Ocean model:HYbrid Coordinate Ocean Model (HYCOM) (Bleck, 2002; Chassignet et al., 2003; Halliwell, 2004) • HYCOM has demonstrated skill related to TC forecasting • Halliwell, 2008 – Improving the Ocean Model Response to Tropical Cyclones • Halliwell, 2006 – Improving Ocean State Initialization in Coupled Tropical Cyclone Forecast Models • Prasad and Hogan, 2007 – Upper ocean response to Hurricane Ivan in a 1/25 nested Gulf of Mexico HYCOM
Coupled Atmosphere-Ocean Model Grid Configurations H. R. Winterbottom and E.P. Chassignet: The Impacts of an Evolving Ocean Boundary Condition on TC Structure and Intensity HYCOM resolution: 1/12o x 1/12o at the equator HYCOM grid dimension: 1063 x 545 x 32 (sub-region of Global HYCOM) WRF-ARW resolution: 8.81-km at 8.05 N, -55.4 W WRF-ARW grid dimension: 1083 x 565 x 35
Coupled Atmosphere-Ocean Model Model Coupling Atmosphere Model Variables : Zonal wind stress : Meridional wind stress : 2-meter temperature : 2-meter specific humidity : Precipitation rate : 10-meter wind speed : Downward long-wave radiation : Downward short-wave radiation Wave Model Variables To be determined Ocean Model Variables : Sea-surface temperature H. R. Winterbottom and E.P. Chassignet: The Impacts of an Evolving Ocean Boundary Condition on TC Structure and Intensity
The Impacts of an Evolving Ocean Boundary Condition Case Study Selection STABLE AIR IN ITS PATH. AFTER ABOUT 24 HR ON THE NHC TRACK...SSTS THEREAFTER SSTS WARM SLIGHTLY AND MOST GLOBAL MODELS FORECAST AN CHANGE IN BETWEEN WHILE THE SYSTEM IS OVER THE COOLEST SSTS. THE STABLE AIR IN ITS PATH. AFTER ABOUT 24 HR ON THE NHC TRACK...SSTS THEREAFTER SSTS WARM SLIGHTLY AND MOST GLOBAL MODELS FORECAST AN CHANGE IN BETWEEN WHILE THE SYSTEM IS OVER THE COOLEST SSTS. THE LIMIT INTENSIFICATION. SSTS ALONG THE TRACK ARE EXPECTED TO LIMIT INTENSIFICATION. SSTS ALONG THE TRACK ARE EXPECTED TO OVER SSTS OF 25 DEGREES C....WHICH IS THE MAIN LIMITING FACTOR FOR THE NEXT COUPLE OF DAYS. THEREAFTER...THE SSTS ALONG THE TRACK ARE OVER SSTS OF 25 DEGREES C....WHICH IS THE MAIN LIMITING FACTOR FOR THE NEXT COUPLE OF DAYS. THEREAFTER...THE SSTS ALONG THE TRACK ARE ATMOSPHERIC ENVIRONMENT BUT OVER MARGINALLY WARM SSTS. SUCH ATMOSPHERIC ENVIRONMENT BUT OVER MARGINALLY WARM SSTS. SUCH CONDUCIVE FOR GRADUAL STRENGTHENING AS SSTS INCREASE AND THE SHEAR THEREAFTER...THE SSTS WILL INCREASE ALONG THE PROJECTED FORECAST TO MOVE OVER MARGINALLY WARM SSTS DURING THE NEXT 24 HOURS WHICH IS EXPECTED TO LIMIT INTENSIFICATION. THEREAFTER...SSTS FOR STRENGTHENING AS SSTS ALONG THE PROJECTED PATH GRADUALLY PROJECTED PATH. BERTHA IS CURRENTLY OVER SSTS OF ABOUT 25 DEGREES CELSIUS...BUT THE SSTS WILL BE INCREASING BY ABOUT ONE DEGREE PER CONVECTION WHICH MAY FORETELL AN INCREASE IN STRENGTH. SSTS UNDER PERIOD...THE SHEAR COULD RELAX AND SSTS INCREASE SO THERE IS SOME STRENGTH LATER IN THE FORECAST AS THE SHEAR RELAXES AND THE SSTS SSTS SLOWLY FALL. THIS ENVIRONMENT IS EXPECTED TO RESULT IN A SLOW DAYS 3 THROUGH 5 DUE TO COOLING SSTS AND THE POTENTIAL INCREASING SSTS. SHEAR IS FORECAST TO INCREASE BY ALL MODELS IN A IN STRENGTH IS FORECAST AS SSTS DIMINISH SLOWLY ALONG THE TRACK. AS SSTS ALONG THE FORECAST TRACK COOL AND THE SHEAR INCREASES. SHEAR AND WANING SSTS. THE EXTRATROPICAL TRANSITION PROCESS SHOULD RAPIDLY DECREASING SSTS...AND BY 120 HR...THE REMNANTS OF BERTHA SYSTEM COULD UPWELL COLDER WATER UNDERNEATH IT. THIS COULD SO. DUE TO ITS SLOW MOTION...BERTHA IS PROBABLY CAUSING UPWELLING TOO MANY HOURS IN THE SAME AREA PRODUCING UPWELLING. THE HURRICANE FUTURE...GIVEN THE EFFECTS OF OCEAN UPWELLING UNDER A STATIONARY UPWELLING COLDER WATER UNDERNEATH IT. THIS SHOULD CAUSE A OCEAN HAS ACQUIRED ENOUGH ORGANIZED CONVECTION TO NOW BE CONSIDERED OCEAN HAS ACQUIRED ENOUGH ORGANIZED CONVECTION TO NOW BE CONSIDERED THE OCEAN IS PLENTY WARM AHEAD OF BERTHA SO THE SHEAR WILL BE THE STRENGTHENING AND THE OCEAN IS PLENTY WARM. HOWEVER...THE VARIOUS CHANGES...EVEN THOUGH THE OCEAN AND ATMOSPHERIC ENVIRONMENTS ARE NOT TO WEAKEN. OCEAN ANALYSES FROM THE ATLANTIC OCEANOGRAPHIC AND OCEAN. THEN...A GRADUAL WEAKENING IS INDICATED. ALTHOUGH IT APPEARS FUTURE...GIVEN THE EFFECTS OF OCEAN UPWELLING UNDER A STATIONARY H. R. Winterbottom and E.P. Chassignet: The Impacts of an Evolving Ocean Boundary Condition on TC Structure and Intensity TC Bertha (2008) – 03 July to 20 July Acquired from http://www.nhc.noaa.gov/archive/2008/BERTHA.shtml
The Impacts of an Evolving Ocean Boundary Condition Case Study Selection H. R. Winterbottom and E.P. Chassignet: The Impacts of an Evolving Ocean Boundary Condition on TC Structure and Intensity TC Bertha (2008) – 03 July to 20 July
The Impacts of an Evolving Ocean Boundary Condition Observation Analysis H. R. Winterbottom and E.P. Chassignet: The Impacts of an Evolving Ocean Boundary Condition on TC Structure and Intensity TC Bertha (2008) – 03 July to 20 July Daily Multi-sensor Improved Sea-Surface Temperature (MISST) TC Bertha (2008) Estimated Cold-Wake TC Bertha (2008) 1705 UTC 10 July Image acquired from http://rapidfire.sci.gsfc.nasa.giv/gallery/?2008192-0710 Track positions obtained from HURDAT (Jarvinen et al., 1984)
The Impacts of an Evolving Ocean Boundary Condition Coupled-Model Atmosphere/Ocean Interactions H. R. Winterbottom and E.P. Chassignet: The Impacts of an Evolving Ocean Boundary Condition on TC Structure and Intensity WRF-ARW Wind Swath and HYCOM SST Cold-Wake Analysis Change in SST Maximum Wind Speed SST (HYCOM) cooling response is greatest within region of maximum winds
The Impacts of an Evolving Ocean Boundary Condition Coupled-Model Atmosphere/Ocean Interactions H. R. Winterbottom and E.P. Chassignet: The Impacts of an Evolving Ocean Boundary Condition on TC Structure and Intensity WRF-ARW Wind Swath and HYCOM SST Cold-Wake Analysis • Maximum wind speed and change in SST are spatially correlated at r = 0.69 • The change in SST is also dependent on the translational speed of TC vortex, the size of the TC vortex, temporal duration of high-winds, the structure of the upper-ocean, ocean and atmosphere boundary-layer processes, etc. • In the case of TC Bertha (2008), the slow translational speed (stalling) and subsequent long-duration high-winds appear to be the mechanisms which induced the substantial cold-wake and eventual weakening of TC
The Impacts of an Evolving Ocean Boundary Condition Static vs. Evolving Ocean Boundary Conditions H. R. Winterbottom and E.P. Chassignet: The Impacts of an Evolving Ocean Boundary Condition on TC Structure and Intensity TC Bertha (2008) – 0000 UTC 10 July to 0000 UTC 13 July Static SST Evolving SST Surface Latent Heat Flux (W/m2)
The Impacts of an Evolving Ocean Boundary Condition Static vs. Evolving Ocean Boundary Conditions H. R. Winterbottom and E.P. Chassignet: The Impacts of an Evolving Ocean Boundary Condition on TC Structure and Intensity TC Bertha (2008) – 0000 UTC 10 July to 0000 UTC 13 July Static SST Evolving SST Surface Moisture Flux (kg m-2 s-1) x 105
The Impacts of an Evolving Ocean Boundary Condition Static vs. Evolving Ocean Boundary Conditions H. R. Winterbottom and E.P. Chassignet: The Impacts of an Evolving Ocean Boundary Condition on TC Structure and Intensity TC Bertha (2008) – 0000 UTC 10 July to 0000 UTC 13 July Static SST Evolving SST Maximum Wind Speed Intensity (kts)
The Impacts of an Evolving Ocean Boundary Condition Static vs. Evolving Ocean Boundary Conditions H. R. Winterbottom and E.P. Chassignet: The Impacts of an Evolving Ocean Boundary Condition on TC Structure and Intensity TC Bertha (2008) – 0000 UTC 10 July to 0000 UTC 13 July Static SST Evolving SST Minimum Sea-Level Pressure (hPa)
The Impacts of an Evolving Ocean Boundary Condition Static vs. Evolving Ocean Boundary Conditions Static SST Evolving SST Observations H. R. Winterbottom and E.P. Chassignet: The Impacts of an Evolving Ocean Boundary Condition on TC Structure and Intensity TC Bertha (2008) – 0000 UTC 10 July to 0000 UTC 13 July Maximum Wind Speed Intensity
The Impacts of an Evolving Ocean Boundary Condition Static vs. Evolving Ocean Boundary Conditions Static SST Evolving SST Observations H. R. Winterbottom and E.P. Chassignet: The Impacts of an Evolving Ocean Boundary Condition on TC Structure and Intensity TC Bertha (2008) – 0000 UTC 10 July to 0000 UTC 13 July
Coupled Atmosphere-Ocean Model Conclusions and Future Work H. R. Winterbottom and E.P. Chassignet: The Impacts of an Evolving Ocean Boundary Condition on TC Structure and Intensity • In the case of TC Bertha (2008), the greatest ocean (SST) response is largely correlated to the regions of maximum wind speed; D’Asaro et al., (2007) concluded similar things for TC Frances (2004) • The use of an evolving SST more closely resembles the temporal modulations and trends for maximum wind speed and minimum sea-level pressure intensity depicted in the observations • Actual model intensity measurements do not correlate with the intensity values seen in the observations • Poor initial conditions for the structure and intensity of the TC vortex • Grid-lengthresolutions which are too coarse to capture appropriate rates of intensification • The impacts of waves and sea-spray have not been included • The choice of atmosphere and ocean model physical parameterizations • Ongoing and future work includes: • Inclusion of a dynamic TC vortex initialization methodology (akin to GFDL) • Wave-model and sea-state parameterizations (Bourassa, 2006) • Assimilation of TC PBL wind profile, TC troposphere thermodynamic, and drag coefficient (Powell et al., 2003) observations