Download
1 / 36
460 likes | 989 Views
Seminar on Impact of Climate Change in Bangladesh and Results from Recent Studies Organized by Institute of Water Modeling (IWM). Downscaling of Global Climate Model (GCM). A.K.M. Saiful Islam. Associate Professor, IWFM Coordinator, Climate Change Study Cell.

E N D
Seminar on Impact of Climate Change in Bangladesh and Results from Recent Studies Organized by Institute of Water Modeling (IWM) Downscaling of Global Climate Model (GCM) A.K.M. Saiful Islam Associate Professor, IWFM Coordinator, Climate Change Study Cell Bangladesh University of Engineer and Technology (BUET)
Presentation Outline • Overview of the Climate System • Modeling of Climate Change • General Circulation Model (GCM) • IPCC SRES Scenarios • Regional Climate Model (RCM) • Climatic Modeling at BUET
Climate Models • Climate models are computer-based simulations that use mathematical formulas to re-create the chemical and physical processes that drive Earth’s climate. To “run” a model, scientists divide the planet into a 3-dimensional grid, apply the basic equations, and evaluate the results. • Atmospheric models calculate winds, heat transfer, radiation, relative humidity, and surface hydrology within each grid and evaluate interactions with neighboring points. Climate models use quantitative methods to simulate the interactions of the atmosphere, oceans, land surface, and ice.
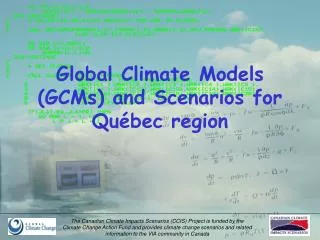
General Circulation Model (GCM) • General Circulation Models (GCMs) are a class of computer-driven models for weather forecasting, understanding climate and projecting climate change, where they are commonly called Global Climate Models. • Three dimensional GCM's discretise the equations for fluid motion and energy transfer and integrate these forward in time. They also contain parameterizations for processes - such as convection - that occur on scales too small to be resolved directly. • Atmospheric GCMs (AGCMs) model the atmosphere and impose sea surface temperatures. Coupled atmosphere-ocean GCMs (AOGCMs, e.g. HadCM3, EdGCM, GFDL CM2.X, ARPEGE-Climate) combine the two models.
GCM typical horizontal resolution of between 250 and 600 km, 10 to 20 vertical layers in the atmosphere and sometimes as many as 30 layers in the oceans.
Hardware Behind the Climate Model • Geophysical Fluid Dynamics Laboratory
Special Report on Emissions Scenarios (SRES) • The Special Report on Emissions Scenarios (SRES) was a report prepared by the Intergovernmental Panel on Climate Change (IPCC) for the Third Assessment Report (TAR) in 2001, on future emission scenarios to be used for driving global circulation models to develop climate change scenarios. • It was used to replace the IS92 scenarios used for the IPCC Second Assessment Report of 1995. The SRES Scenarios were also used for the Fourth Assessment Report (AR4) in 2007.
SERS Emission Scenarios • A1 - a future world of very rapid economic growth, global population that peaks in mid-century and declines thereafter, and the rapid introduction of new and more efficient technologies. Three sub groups: fossil intensive (A1FI), non-fossil energy sources (A1T), or a balance across all sources (A1B). • A2 - A very heterogeneous world. The underlying theme is that of strengthening regional cultural identities, with an emphasis on family values and local traditions, high population growth, and less concern for rapid economic development. • B1 - a convergent world with the same global population, that peaks in mid-century and declines thereafter, as in the A1 storyline. • B2 - a world in which the emphasis is on local solutions to economic, social and environmental sustainability.
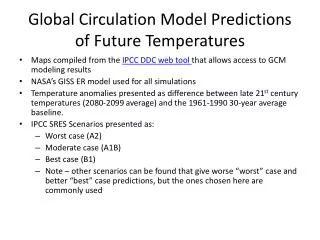
GCM output described in the 2007 IPCC Fourth Assessment Report (SRES scenarios), multilayer mean
Arctic Sea Ice Prediction using community climate system model Arctic Sea Ice in 2040 Arctic Sea Ice in 2000
Prediction of Global Warming • Figure shows the distribution of warming during the late 21st century predicted by the HadCM3 climate model. The average warming predicted by this model is 3.0 °C.
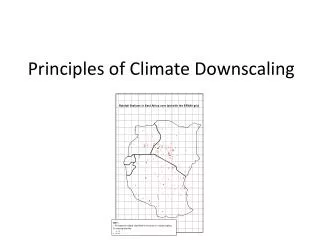
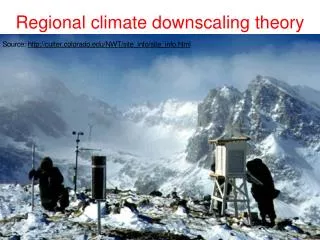
Regional Climate modeling • An RCM is a tool to add small-scale detailed information of future climate change to the large-scale projections of a GCM. RCMs are full climate models and as such are physically based and represent most or all of the processes, interactions and feedbacks between the climate system components that are represented in GCMs. • They take coarse resolution information from a GCM and then develop temporally and spatially fine-scale information consistent with this using their higher resolution representation of the climate system. • The typical resolution of an RCM is about 50 km in the horizontal and GCMs are typically 500~300 km
Regional Climate change modeling in Bangladesh • PRECIS regional climate modeling is now running in Climate change study cell at IWFM,BUET. • Uses LBC data from GCM (e.g. HadCM3). • LBC data available for baseline, A2, B2, A1B scenarios up to 2100. • Predictions for every hour. Needs more than 100 GB free space.
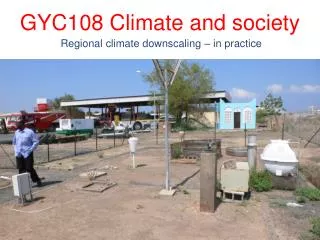
Topography of Experiment Domain Simulation Domain = 88 x 88 Resolution = 0.44 degree Zoom over Bangladesh
Predicted Change of Mean Temperature (0C) using A1B Baseline = 2000 2090 2050
Predicting Maximum Temperature using A2 Scenarios [Output of PRECIS model using SRES A2 scenario]
Predicting Minimum Temperature using A2 Scenarios [Output of PRECIS model using SRES A2 scenario]
Change of Mean Rainfall (mm/d) using A1B Scenarios Baseline = 2000 2050 2090
Predicting Rainfall using A2 Scenarios [Output of PRECIS model using SRES A2 scenario]
Change of mean climatic variables of Bangladesh using A1B Scenarios Temperate (0C) Rainfall (mm/d)
Trends of Temperature of Bangladesh (1947-2007) Max. Temp. =0.63 0C/100 year Min. Temp. =1.37 0C/100 year
Spatial Distribution of Trends of Temperature (1947-2007) • Maximum Temperature • Maximum increase: 0.0581 at Shitakunda • Minimum increase: -0.026 at Rangpur • Minimum Temperature • Maximum increase: 0.0404 at Bogra • Minimum increase: -0.023 at Tangail
Conclusions • Analysis of the historic data (1948-2007) shows that daily maximum and minimum temperature has been increased with a rate of 0.63 0C and 1.37 0C per 100 years respectively. • PRECIS simulation for Bangladesh using A1B climate change scenarios showed that mean temperature will be increased at a constant rate 40C per 100 year from the base line year 2000. • On the other hand, mean rainfall will be increased by 4mm/d in 2050 and then decreased by 2.5mm/d in 2100 from base line year 2000.
Recommendations • In future, Climate change predictions will be generated in more finer spatial scale(~25km). • PRECIS model will be simulated with other Boundary condition data such as ECHAM5 using A1B scenarios. • Results will be compared with other regional climate models such as RegCM3 etc.