Download
1 / 26
260 likes | 336 Views
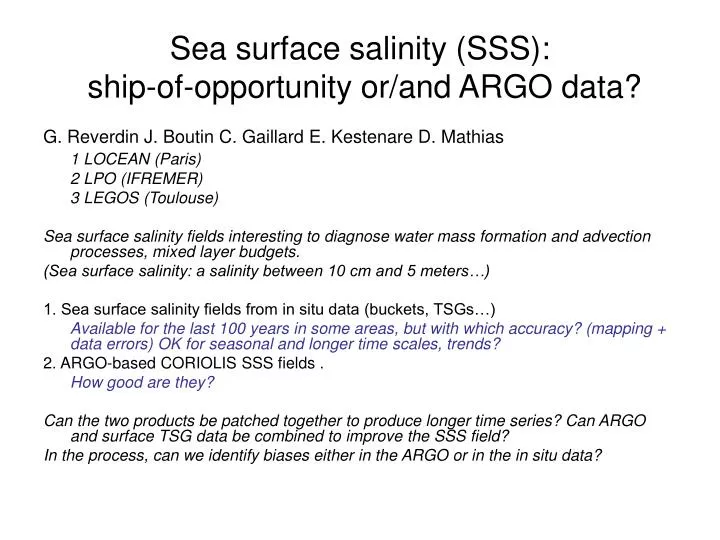
Sea surface salinity (SSS): ship-of-opportunity or/and ARGO data?. G. Reverdin J. Boutin C. Gaillard E. Kestenare D. Mathias 1 LOCEAN (Paris) 2 LPO (IFREMER) 3 LEGOS (Toulouse)

E N D
Sea surface salinity (SSS): ship-of-opportunity or/and ARGO data? G. Reverdin J. Boutin C. Gaillard E. Kestenare D. Mathias 1 LOCEAN (Paris) 2 LPO (IFREMER) 3 LEGOS (Toulouse) Sea surface salinity fields interesting to diagnose water mass formation and advection processes, mixed layer budgets. (Sea surface salinity: a salinity between 10 cm and 5 meters…) 1. Sea surface salinity fields from in situ data (buckets, TSGs…) Available for the last 100 years in some areas, but with which accuracy? (mapping + data errors) OK for seasonal and longer time scales, trends? 2. ARGO-based CORIOLIS SSS fields . How good are they? Can the two products be patched together to produce longer time series? Can ARGO and surface TSG data be combined to improve the SSS field? In the process, can we identify biases either in the ARGO or in the in situ data?
SSS during 1977-2002 from in situ data (recently, from ORE SSS, CORIOLIS, GOSUD, pCO2 ships-of-opportunity, PIRATA…) First important step: correct data from expected biases (TSGs and bucket samples) Climatology and deviation from earlier climatologies Reverdin et al., 2006: RK
Data distribution: patchy and variable in time Large areas where seasonal-scale variability poor Deviations from climatology: mapping show data distribution
Percentage of signal in the mapping error (normalized by signal) Diff between forward and Backward analysis Estimated error
Reconstructed (mapped) variability consistent with data (not surprising!) Inter-annual persistence Congo river water?
Interannual Rms variability varies seasonally; scales of signal too, but poorly known
Cross-correlation of SSS with E-P-Ekman (« surface forcing ») At mid-latitude, More response to Winter forcing SSS « responds » To « surface forcing »
Spatially/annually averaged SSS and surface forcing Low frequencies differ From « local forcing » Western subtropics Response to ENSO
Long-going sampling in subpolar gyre near 60°N Decadal and multi-decadal time scales Poor sampling Note: little winter (DJFM) data (in particular before 1960s)
Recent update with Nuka Arctica TSG data The recent High SSS
Comparison with ARGO-based CORIOLIS S(5m) product (selecting ‘reliable’ data, Autret and Gaillard, 2006) Diff=0.003 (rms=0.035-0.041) Trends and seasonal cycle well reproduced
ARGO-based CORIOLIS product also close to Reverdin et al. In situ maps (within 0.1), except in areas with large gradients and variability However, comparison too short to be conclusive
No abnormal residual, although fairly large residuals in the Labrador Sea and in slope water showed that The Coriolis analysis was not well constrained there
TSG data from 14 drifters in Bay of Biscay from which bias known These drifters were able to indicate bias in an ARGO float of -0.010 psu
Residuals from analysis fairly small, as expected from The known biases. But thoses biases not reproduced To better than 0.03 psu
+0.011 (real= +0.005)
Carioca drifters: SSS expected to be accurate to within 0.010 psu Can they be used to identify biases in ARGO data? 32 ARGO float profiles with S(5m) and T(5m) at less than 10 days and 100km from CARIOCA buoys (water pumped at 2m): in 24 cases, differences less than 0.02psu
Possible ARGO S negative bias But too large distance to conclude
- Can surface TSG and ARGO-based products be patched together to produce longer time series? Yes, but with more effort in western Atlantic - Can ARGO and surface TSG data be combined to improve the SSS field? Yes, but after correction biasesin surface data - In the process, can we identify biases either in the ARGO or in the in situ data? Probably, but not often.
CARIOCA ARGO FLOATS