Download
1 / 18
180 likes | 382 Views
Sea surface roughness and foam signature onto SMOS brightness temperature and salinity. X. Yin 1 , J. Boutin 1 , N. Martin 1 , J. Vergely 2 , P. Spurgeon 3. LOCEAN / IPSL, Paris, France ACRI-ST, Sophia Antipolis, France ARGANS Ltd, Plymouth, England.

E N D
Sea surface roughness and foam signature onto SMOS brightness temperature and salinity • X. Yin1, J. Boutin1, N. Martin1, J. Vergely2, P. Spurgeon3 • LOCEAN / IPSL, Paris, France • ACRI-ST, Sophia Antipolis, France • ARGANS Ltd, Plymouth, England
Motivation: SMOS Model 1 - ARGO SSS (3-31 August 2010; asc orbits)versus wind speed (center of orbit) Colocation radius: +/-5days; +/-50km ITCZ trop Pac N: DSSS=-0.18+/-0.44 N=236 Subtropical Atl N: DSSS=0.1+/-0.35 N=59 South Indian: DSSS=0.11+/-0.46 N=50 South Pacific: DSSS=0.09+/-0.56 N=160 Pre-launch model 1 (2 scale model + wave spectrum of Durden & Vesecky *2, no foam)
Adjustment of some parameters of roughness and foam modeling Roughness model 1:Omnidirectional wave spectrum Durden & Vesecky,1985 : a0?Original publication: a0=0.004; DV2, a0=0.008 Th_30° DV2 Nadir • At 15°C, a 0.1K Tb variation can be generated by : • 0.2pss SSS variation • or • - 0.5m/s wind speed variation ~0.2K/m/s Dinnat et al., IJRS, 2002, Radio Science, 2003 10m equivalent neutral wind speed (m/s) Foam coverage (from Monahan & O'Muircheartaigh 1986): b? c? original publication:b=1.95×10⁻⁵, c=2.55 ; ΔT =Tsea-Tair (neglected in this first step study); in first SMOS SSS1 processing, F=0: no foam. Foam emissivity (Stogryn, 1972): assumed to be correct
8m/s<U<17m/s Foam coverage model b, c Model parameters fitting Wind induced component of emissivity extracted from SMOS data corrected from flat sea emission, atmospheric effects, galactic noise, Faraday rotation 3m/s<U<7m/s Wave spectrum parameter a0 (prior=0.004 – 0.008)
Radiometric accuracy SMOS data used in the fit SMOS Tbs: Tbs along track (~ no mixing of polarization) in the AFFOV (good radiometric accuracy) from 19 ascending orbits in August (low galactic noise) in the South Pacific (far from land) from 50°S to 0°N – Incidence angles from 20° to 55° Incidence angle (°) Along track in the AFFOV (20-55° in step of 5°) 5K 5K 0 0
Wind Speed data • 19 half orbits of SMOS in the southern Pacific. 2 sources of wind speeds considered: SMOS-ECMWF and/or SSMI from RemSS: • ECMWF WS • ECMWF WS with the differences between ECMWF and SSMI WS restricted to be less than 2 ms-1 • SSMI WS collocated at +-0.5h +-50km,100km away from rain
Comparison of SMOS-foam coverage model with existing parametrizations (all ECMWF-SMOS WS) (ECMWF only if WS consistent with SSM/I) (SSM/I) Relatively small impact of foam (thin passive foam has probably a small effect)
Pre-launch model 1 The original model
H pol. 20° V pol. 20° SMOS measured and simulated emissivity versus ECMWF wind speedH & V and various incidence angles in AFFOV H pol. 30° V pol. 30° H pol. 40° V pol. 40° H pol. 50° V pol. 50° H pol. 55° V pol. 55° ECMWF WS ECMWF WS
Comparison with ARGO SSS 1. The tropical Southern Pacific ocean (20°S10°S- 140°W110°W) far away from continent and island characterized by relative stable moderate wind speed and high SST; mean (standard deviation) of SST and SSS are 24.5 (1.0) °C and 36.2 (0.3) pss 2. The high latitude Southern Pacific ocean (50°S45°S- 180°W100°W) characterized by very variable wind speed and low SST; mean (standard deviation) of SST and SSS are 9,8 (1.8) °C and 34,4 (0.2) pss
Comparison with ARGO measurements August; ascending orbits SMOS SSS retrieved with the pre-launch model 1 SMOS SSS with the new model M1 Less biases than pre-launch model at high wind speed but still large scatter: We trust more retrievals between 3 and 12m/s in red for the tropical Southern Pacific and in green for the high latitude Southern Pacific
Monthly averages, 170 Ascending orbits, Pacific Ocean 100W-140W,August 2010 SSS North-South profile, SMOS SSS <300km New parameters for roughness and foam coverage prelaunch model 1 (DV2) Comparisons w.r.t WOA05 climatology (similar to ARGO analysed map)
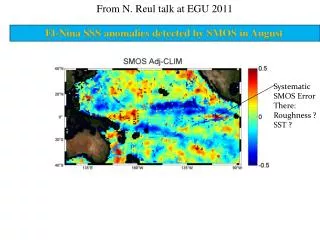
SMOS SSS anomaly in the east equatorial Pacific is related to WS correction 1 month (170 orbits in Pacific Ocean) SMOS SSS <300km ECMWF-SMOS WS 1m/s Comparisons w.r.t WOA05 climatology (similar to ARGO analysed map)
Monthly wind speed Radiometer wind speeds lower than ECMWF in that region because of strong surface currents SMOS retrieved WS SSMI radiometric WS (RSS monthly product) (SSMI 19/22/37 GHz) ECMWF
Summary 1. SMOS data evidence that Tb(ws) is non linear 2. New paramters of DV spectrum and foam coverage model are obtained by fitting to SMOS data 3. Preliminary validation of our new model shows decrease of mean retrieved SSS biases in wind speed range of 3-17 ms-1 with respect to the results with the pre-launch model. 4. SMOS retrieved wind speed is partly (but not entirely) corrected for inconsistencies between ECMWF wind speeds and true wind speeds => it remains flaws in SMOS SSS when there are large WS discrepancies => when looking at SMOS SSS anomalies; check first the consistency between ECMWF and SMOS retrieved WS! Future 1. Repeat the same work with L1C v500 and a larger number of data. 2. Find a tradeoff between giving more freedom to the WS in the retrieval and not degrade SSS
Statistics of the SMOS SSS collocated with the ARGO at +/-5days and +/-50km during August ascending passes
EV at 0 deg incidence angle EH at 0 deg incidence angle