Download
1 / 64
660 likes | 896 Views
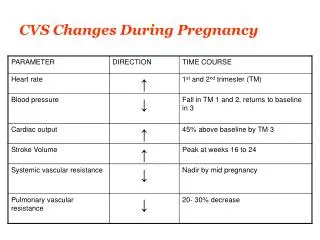
Cardiac Resynchronization and Defibrillation Therapies:. Complementary Approaches to the Management of Heart Failure. Ventricular Resynchronization Pathophysiology and Identification of Responders. Mechanisms of Dysfunction Due to Contractile Discoordination. Reduced ejection volume

E N D
Cardiac Resynchronizationand Defibrillation Therapies: Complementary Approachesto the Managementof Heart Failure
Ventricular ResynchronizationPathophysiology and Identification of Responders
Mechanisms of Dysfunction Dueto Contractile Discoordination • Reduced ejection volume • Internal sloshing of cavitary blood volume from prematurely activated region to late-activated one • Increased end-systolic volume (stress) • Mechano-energetic inefficiency • Reduced systolic function despite maintained or increasedenergetic expenditure • Late systolic stretch • Cross-bridge detachment, reduced contractility • Delayed relaxation • After-contraction/arrhythmia • Mitral valve dysfunction • Papillary muscle discoordination Kass DA. Rev Cardiovasc Med. 2003;4(suppl 2):S3-S13.
Impact of Mechanical Dyssynchrony A MRI-Tagged 3-D Cine-Imaging Adapted from Kass DA. Rev Cardiovasc Med. 2003;4(suppl 2):S3-S13.Adapted from Leclercq C, et al. Circulation. 2001;106:1760-1763.
Disparities in Regional WorkloadResulting From Dyssynchrony Early Activated Late Activated 20 20 Area = Regional Work Fiber Stress Fiber Stress 0 0 0.0 0.1 0.0 0.1 -0.1 -0.1 Fiber Strain Regional Blood Flow Glucose Metabolism Adapted from Kass DA. Rev Cardiovasc Med. 2003;4(suppl 2):S3-S13.
Discoordinate Motion Adverse Effects on Global Function From RV-Pacing–Induced Dyssynchrony Normal Sinus Rhythm Acute Dyssynchrony (RV Pace) 80 40 LV Pressure (mm Hg) 0 30 60 90 LV Volume (mL) Adapted from Kass DA. Rev Cardiovasc Med. 2003;4(suppl 2):S3-S13.
Do We ResynchronizeWith Biventricular or Left Ventricular Pacing?
CRT Enhances Cardiac Mechano-Energetic Efficiency .24 LV pacing *P< 0.01 †P< 0.05 Mean ±SEM Dobutamine * P< 0.05 .22 40 .20 * (Relative Units) MVO2/HR 20 Change (%) .18 † † 0 .16 .14 -20 MeanCorF AVO2 MVO2 dP/dtmax PP 500 600 700 800 900 1000 dP/dtmax (mm Hg) Adapted from Nelson GS, et al. Circulation. 2000;102:3053-3059.
Single-Site LV PacingWorks Just as Well LV Free Wall per Circulation Biventricular 120 120 80 80 LV Pressure (mm Hg) LV Pressure (mm Hg) 40 40 0 0 0 100 200 300 0 100 200 300 LV Volume (mL) LV Volume (mL) Adapted from Kass DA. Rev Cardiovasc Med. 2003;4(suppl 2):S3-S13.
Regional Wall Motion With CRT Septum 0 Seconds 0.4 Regional Fractional Area Change Lateral 0 Seconds 0.4 Pacing Off Pacing On Adapted from Kass DA. Rev Cardiovasc Med. 2003;4(suppl 2):S3-S13. Adapted from Kawaguchi M, et al. J Am Coll Cardiol. 2002;39:2052-2058.
Global Chamber Effects of CRT:Acute Human Studies Pacing ON Pacing OFF 2-Min Steady State 1193.0 1120.0 dP/dt dP/dt -841.0 -727.0 114.0 114.0 AOP AOP 54.7 50.8 113.0 113.0 LVP LVP 0.4 1.0 1151.0 1151.0 870.0 865.0 0.0 2.8 5.6 8.4 11.2 2.5 5.0 7.5 10.0 0.0 Seconds Seconds 120 80 LV Pressure (mm Hg) 40 0 0 100 200 300 Adapted from Kass DA. Rev Cardiovasc Med. 2003;4(suppl 2):S3-S13. LV Volume (mL)
Ventricular Reverse RemodelingWith Resynchronization Control 6-month CRT CRT 6-month P<0.001 P<0.001 7.5 30 Ejection Fraction (%) End-Diastolic Dimension (mm) 6.5 20 6.0 10 Placebo n=63 CRT n=61 Placebo n=81 CRT n=63 Adapted from Abraham WT, et al. N Engl J Med. 2002;346:1845-1853.
How Important Are Pacing Site, Atrioventricular Delay, and Ventricular to Ventricular Delay?
AV Interval Optimization 16 24 LVBV LVBV 12 18 8 12 Change in dP/dtmax (%) Change in Aortic PP (%) 4 6 0 0 1 1 -4 -6 AV delay(0 to PR – 30 msec) AV delay(0 to PR – 30 msec) -8 -12 Adapted from Auricchio A, et al. Circulation. 1999;99:2993-3001.
Synchronous vs Non-Synchronous BV Pacing: Is RV-LV Delay Important? 6 * * 5 4 Systolic Function (Echo Index) 3 2 1 RV Preactivation S LV Preactivation 0 * P<0.01 vs. Simultaneous (s)Sogaard P, et al. Circulation. 2002;106:2078-2084.
Can We Predict Responders? • Wide QRS complex • Widely used, but only broadly correlates with acute response • Weak predictor of chronic response • Mechanical dyssynchrony • More direct target of CRT • Measures of wall dyssynchrony (MRI, ECHO, TDI) best correlate with acute and chronic responsiveness • Basal dysfunction • Low contractile state and marked P-R delay are likely additional features of responders Kass DA. Rev Cardiovasc Med. 2003;4(suppl 2):S3-S13.
QRS as a Predictor of Response QRS duration is only weakly correlated with acute improvement1,2 However, change in QRS duration does not correlate with acute improvement2 60 100 r =0.51 75 40 Change in dP/dtmax (%) 50 Change in dP/dtmax (%) 25 20 0 -25 0 -50 -30 -10 0 10 30 50 100 150 200 250 Surface QRS (msec) % QRS (msec) D 1. Adapted from Auricchio A, et al. Circulation. 1999;99:2993-3001.2. Nelson GS, et al. Circulation. 2000;101:2703-2709.
More Direct Methodsto Assess Dyssynchrony • Interventricular delay • RV/LV pressure plot (area in loop) • Interventricular delay • QRS onset-pulmonary flow onset – QRS onset-aortic flow onset >25 msec • Intraventricular delay • Strain rate TDI • M-mode ECHO • Echo contrast analysis • QRS onset-end lateral wall contraction >290 msec • QRS onset-end lateral wall contraction >QRS onset-mitral E-wave onset Kass DA. Rev Cardiovasc Med. 2003;4(suppl 2):S3-S13.
M-mode Echo Assessmentfor Predicting Responders +20 r =-.70P=.001 0 -20 -40 LVESVI (mL/m2) -60 -80 -100 D 20 60 140 220 300 380 SPWMD (msec) Adapted from Pitzalis MV, et al. J Am Coll Cardiol. 2002;40:1615-1622.
TDI Assessmentfor Predicting Responders 80 60 40 Change in LVEF (%) 20 0 20 40 60 80 -20 -40 Percentage of LV Base With DLC Adapted from Sogaard P, et al. J Am Coll Cardiol. 2002;40:723-730.
Potential Causesfor Lack of Response • Poor lead placement • Site matters; lateral placement is usually better • Improper setting of AV delay • Loss of preexcitation; suboptimal atrial filling, exacerbation of mitral regurgitation • Infarcted underlying substrate • Cannot be stimulated and thus cannot be resynchronized Kass DA. Rev Cardiovasc Med. 2003;4(suppl 2):S3-S13.
Summary • Cardiac dyssynchrony reduces net systolic function and energetic efficiency, inducing marked regional heterogeneity of wall stress and molecular signaling • CRT is most effective if targeted to hearts with discoordinate contraction, rather than QRS widening • In appropriate patients, improvement in systolic functionand energetics from CRT can be marked • Defining intraventricular mechanical dyssynchronyseems at present to be the most reliable variable for predicting responders—but more work is needed to define the most reliable dyssynchrony measurement and test its prospective utility
Heart Failure Heart failure is a clinical syndrome (ie, there are signs and symptoms) characterized in most patients by dyspnea and fatigue at rest and/or with exertion caused by underlying structural and/or functional heart disease Francis GS, Tang WH. Rev Cardiovasc Med. 2003;4(suppl 2):S14-20.
Congestive Heart FailureScope of the Problem • Nearly 900,000 annual hospital admissions (increased 90% in past 10 years)1 • Most common discharge diagnosis for patients olderthan 65 years2 • 6.5 million hospital days per year1 • Single largest expense for Medicare1 • Annual hospital/nursing home costs: $15.4 billion3 • Hunt SA, et al. ACC/AHA Guidelines for the Evaluation and Management of Chronic Heart Failure in the Adult. 2001. • Graves EJ, Gillum BS. 1994 Summary: National Hospital Discharge Survey. National Center for Health Statistics; 1996. • AHA. 2002 Heart and Stroke Statistical Update; 2001.
Heart Failure Hospitalizations Women Men The Number of Heart Failure Hospitalizations Is Increasing in Both Men and Women 600,000 500,000 400,000 Annual Discharges 300,000 200,000 100,000 0 '79 '81 '83 '85 '87 '89 '91 '93 '95 '97 '99 Year CDC/NCHS: hospital discharges include patients both living and dead. AHA. 2002 Heart and Stroke Statistical Update. 2001.
Diagnosis of CHF:Clinical Challenge • Signs and symptoms of heart failure, such as shortness of breath and edema, have a broad differential diagnosis1 • Chest x-ray findings have limited accuracyfor CHF1 • 20% to 40% of patients with CHF have normalsystolic function2 • Dao Q, et al. J Am Coll Cardiol. 2001;37:379-385. • Hunt SA, et al. ACC/AHA Guidelines for the Evaluation and Management of Chronic Heart Failure in the Adult; 2001.
New York Heart Association Functional Classification Functional Class Patient Limitations • None • Ordinary physical activity does not cause undue fatigue, palpitation, dyspnea, or anginal pain • Often were previously symptomatic but are now in a well-compensated state Class I Class II • Slight • Patient comfortable at rest • Ordinary physical activity results in fatigue, shortness of breath, palpitations,or angina The Criteria Committee of the NYHA. Diseases of the Heart and Blood Vessels: Nomenclature and Criteria for Diagnosis. 6th ed. 1964.
New York Heart Association Functional Classification Functional Class Patient Limitations • Marked • Patient is comfortable at rest • Less than ordinary activity leads to symptoms Class III Class IV • Severe • Inability to carry on physical activity without symptoms • Patient is symptomatic at rest • Any physical activity increases symptoms The Criteria Committee of the NYHA. Diseases of the Heart and Blood Vessels: Nomenclature and Criteria for Diagnosis. 6th ed. 1964.
ACC/AHA Stages of Heart Failure: Stages A and B Stage A Patients at high risk of developing heart failure as a result of the presence of conditions that are strongly associated with the development of heart failure. These patients do not have any identified structural or functional abnormalities of the pericardium, myocardium, or cardiac valves and have never shown signs or symptoms of heart failure Stage B Patients who have developed structural heart disease that is strongly associated with the development of heart failure but who have never shown signs or symptoms of heart failure Hunt SA, et al. J Am Coll Cardiol. 2001;38:2101-2113.
ACC/AHA Stages of Heart Failure: Stages C and D Stage C Patients who have current or prior symptoms of heart failure associated with underlying structural heart disease Stage D Patients who have advanced structural heart disease and marked symptoms of heart failure at rest despite maximal medical therapy and who require specialized interventions Hunt SA, et al. J Am Coll Cardiol. 2001;38:2101-2113.
Heart FailurePathophysiology • Etiology of heart failure includes1-5: • Structural changes such as loss of myofilaments • Disorganization of the cytoskeleton • Apoptosis and necrosis • Changes in heart size and shape (remodeling) • Disturbances in Ca2+ homeostasis • Alterations in receptor density and coupling to G-proteins • Alterations in G-proteins • Francis GS, Tang WH. Rev Cardiovasc Med. 2003;4(suppl 2):S14-20. • Francis GS. Am J Med. 2001;110(suppl 7A):37S-46S. • Shah M, et al. Rev Cardiovasc Med. 2001;2(suppl 2):S2-S6. • Ceconi C, et al. Rev Port Cardiol. 1998;17(suppl 2):1179-1191. • Mann DL. Circulation. 1999;100:999-1008.
Heart FailurePathophysiology • Etiology of heart failure includes1-7: • Alterations in signal transduction pathways • Switch to fetal gene programs—increase -myosin heavy chain, decrease -myosin heavy chain, increase ANP, increase BNP • Increase collagen synthesis, increase matrix metalloproteinases • Na+ and water retention • Reflex control disturbances • Myocyte hypertrophy • Altered myocardial energetics • Katz AM. Med Clin North Am. 2003;87:303-316. • Francis GS. Am J Med. 2001;110(suppl 7A):37S-46S. • Iwanaga Y, et al. J Am Coll Cardiol. 2000;36:635-642. • Francis GS, Tang WH. Rev Cardiovasc Med. 2003;4(suppl 2):S14-S20. • Shah M, et al. Rev Cardiovasc Med. 2001;2(suppl 2):S2-S6. • Wilson EM, et al. J Card Fail. 2002;8:390-398. • Jugdutt BI. Curr Drug Targets Cardiovasc Haematol Disord. 2003;3:1-30.
Heart Failure Pathophysiology Fall in LV Performance Myocardial Injury Activation of RAAS, SNS, ET, and Others ANP BNP Peripheral Vasoconstriction Hemodynamic Alterations Myocardial Toxicity Remodeling and Progressive Worsening of LV Function Heart Failure Symptoms Morbidity and Mortality Shah M, et al. Rev Cardiovasc Med. 2001;2(suppl 2):S2-S6.
Heart FailureLeft Ventricular Dysfunction • Mechanisms by which elevated LV filling pressure could contribute to mortality in HF include1-3: • Stretch-induced angiotensin II release • Mechanically induced myocardial structural remodeling • Progressive atrioventricular valvular regurgitation • Myocardial stretch-induced increase in intracellular cAMPand calcium • Decrease in vagal activity secondary to stretching of cardiac mechanoreceptors • Leri A, et al. J Clin Invest. 1998;101:1326-1342. • Fonarow GC. Rev Cardiovasc Med. 2001;2(suppl 2):S7-S12. • Cerati D, Schwartz PJ. Circ Res. 1991;69:1389-1401.
Heart FailureLeft Ventricular Dysfunction • Changes associated with LVAD bridge to transplant experience 1990s1-4: • Decrease in chamber size • Enhanced -adrenergic response • Reversal of defects in sarcoplasmic reticulum (SR) Ca2+ cycling • Normalization of gene expression • Normalization of neurohormones and cytokines 1. Mann DL, Willerson JT. Circulation. 1998;98:2367-2369.2. Heerdt PM, et al. Circulation. 2000;102:2713-2719. 3. Ogletree-Hughes ML, et al. Circulation. 2001;104:881-886.4. McCarthy PM, Hoercher K. Prog Cardiovasc Dis. 2000;43:37-46.
Heart FailureLeft Ventricular Dysfunction • Transition from LV dysfunction to HF1-3: • Cell dropout (apoptosis) • Myocyte elongation, hypertrophy • Myocyte slippage 1. Mann DL. Circulation. 1999;100:999-1008. 2. Francis GS. Am J Med. 2001;110(suppl 7A):37S-46S. 3. D'Armiento J. Trends Cardiovasc Med. 2002;12:97-101.
Effects of Resynchronizationon LV Performance Ejection Fraction (%) Left Ventricular Volume (mL) 225 45 200 40 175 35 150 30 125 25 100 20 off-immed off-1wk off-4wk Baseline 1wk 1mo 3mo off-immed off-1wk off-4wk Baseline 1wk 1mo 3mo dP/dtmax (mm/Hg/sec) 1000 900 800 700 600 500 400 off-immed off-1wk off-4wk Baseline 1wk 1mo 3mo Yu CM, et al. Circulation. 2002;105:438-445.
Effects of Resynchronizationon LV Performance Mitral Regurgitation (%) 40 35 30 25 20 15 10 off-immed off-1wk Baseline 1wk 1mo 3mo off-4wk Left Ventricular Filling Time (msec) Isovolumetric Contraction Time (ms) 500 160 150 140 450 130 120 400 110 100 350 90 80 300 70 60 250 50 off-immed off-1wk off-4wk Baseline 1wk 1mo 3mo off-immed off-1wk off-4wk Baseline 1wk 1mo 3mo Yu CM, et al. Circulation. 2002;105:438-445.
Summary • Heart failure is a major medical and economic burden that is growing in incidence with the aging of America • The pathogenesis of heart failure begins with an index event and is characterized by progressive remodeling of the heart • Neurohormones are an important part of the pathogenesis of heart failure; only those drugs that inhibit the RAAS and SNS have been shown to slow or reverse remodeling and improve survival • Devices also can reverse the remodeling process and improve survival • Device placement will likely complement pharmacologic therapies in the HF patient with dyssynchrony
Device Selection:CRT Alone VersusCRT Plus Implantable Cardioverter Defibrillator (ICD)
Risk-Stratification for Sudden Cardiac Death PVCs VT-NS PVC=premature ventricular complexes; VT-NS=nonsignificant ventricular tachycardia;VT-S=significant ventricular tachycardia; VF=ventricular fibrillation. Prystowsky EN. Am J Cardiol. 1988;61:102A-107A.
CAST: Survival 100 Placebo (N=725) 95 Survival (%) 90 Encainide or flecainide (N=730) 85 P=0.0003 450 0 50 100 150 200 250 300 350 400 500 Days After Randomization CAST Investigators. N Engl J Med. 1989;321:406-412.
EMIAT: All-Cause Mortality LVEF and by Group Ejection fraction 31%-40% Probability of Survival Probability of Survival Amiodarone Placebo Ejection fraction < 30% Months Since Randomization Months Since Randomization Julian DG, et al. Lancet.1997;349:667-674.
CAMIAT: All-Cause Mortalityand Nonarrhythmic Death Amiodarone Placebo Cumulative Risk (%) P=0.130 Cumulative Risk (%) P=0.072 Months Since Randomization Months Since Randomization Cairns JA, et al. Lancet.1997;349:675-682.
Primary Prevention Post-MI Trials 80 70 55 60 54 50 Mortality Reduction w/ICD Rx (%) 40 31 30 20 10 0 MADIT-II320 Months MADIT227 Months MUSTT127 Months • Buxton AE, et al. N Engl J Med. 1999;341:1882-1890. • Moss AJ, et al. N Engl J Med. 1996;335:1933-1940. • Moss AJ, et al. N Engl J Med. 2002;346:877-882.
MUSTT and MADIT: Overview MUSTT (N=704) 39 mos 66% 30% 5 40% 64% MADIT (N=196) 27 mos 71% 26% 9 18% 65% Mean time (MI to enrollment) % Prior CABG or PTCA LVEF (mean) VT-NS (mean beats) % Beta-blocker at discharge Class II-III (% patients) Adapted from Prystowsky EN. Am J Cardiol. 2000;86(Suppl 1):K34-K39.
MUSTT Study Hypothesis: Antiarrhythmic therapy guidedby EP testing can reduce the risk of arrhythmic death and cardiac arrest in patients with: Coronary artery disease LVEF <40% Nonsustained VT(3 beats – 30 sec; rate >100 bpm) Buxton AE, et al. N Engl J Med. 1999;341:1882-1890.
MUSTT Randomized Patients:Arrhythmic Death or Cardiac Arrest 1.0 EP-Guided 0.9 0.8 Control 0.7 Event-Free Rate P=0.04 0.6 0.5 0.4 0.3 0.2 0.1 0.0 0 3 6 9 12 15 18 21 24 27 30 33 36 39 42 45 48 51 54 57 60 Months After Enrollment Buxton AE, et al. N Engl J Med. 1999;341:1882-1890.
MUSTT Randomized Patients:Arrhythmic Death or Cardiac Arrest EP ICD 1.0 0.9 Control 0.8 0.7 EP no ICD Event-Free Rate 0.6 P<0.001 0.5 0.4 0.3 0.2 0.1 0.0 0 3 6 9 12 15 18 21 24 27 30 33 36 39 42 45 48 51 54 57 60 Months After Enrollment Buxton AE, et al. N Engl J Med. 1999;341:1882-1890.