State Reduction: Row Matching
130 likes | 341 Views
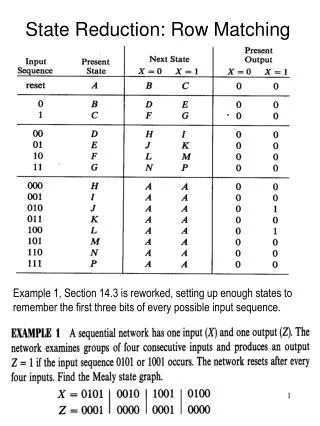
State Reduction: Row Matching. Example 1, Section 14.3 is reworked, setting up enough states to remember the first three bits of every possible input sequence. State Reduction: Row Matching. D. E. J. H. State Reduction: Row Matching. Reduced State Table and Graph. Equivalent States.

State Reduction: Row Matching
E N D
Presentation Transcript
State Reduction: Row Matching Example 1, Section 14.3 is reworked, setting up enough states to remember the first three bits of every possible input sequence.
State Reduction: Row Matching D E J H
State Reduction: Row Matching Reduced State Table and Graph
Equivalent States Theorem 15.1 Two states p and q of a sequential network are equivalent iff for every single input X, the outputs are the same and the next states are equivalent, that is, l (p,X) = l (q,X)and d (p,X) = d (q,X) where l (p,X) is the output given the present state p and input X and d (p,X) is the next state given the present state p and input X. The row matching procedure is a special case of this theorem in which the next states are actually the same instead of just being equivalent Table 13-4
Implication Chart Method Self-implied pairs redundant
Initial Chart d-f square has an X First Pass -eliminating implied pairs
First Pass Second Pass -e.g. place X in square a-g since square b-d has an X.
Original State Table Second Pass Reduced State Table -rows d, e eliminated
Implication Chart Method: Summary 1. Construct a chart which contains a square for each pair of states. 2. Compare each pair of rows in the state table. If the outputs associated with states i and j are different, place an X in square i-j to indicate non- equivalence. If the outputs are the same, place the implied pairs in square i-j. (If the next states of i,j are m,n resp. then m-n is an implied pair.) Eliminate any self-implied pairs which are redundant by crossing then out. If the outputs and next states are the same (or if i-j only implies itself) place a check mark in square i-j to indicate i ºj. 3. Second Pass: Go through the table column by column. Eliminate (place an X) the square with implied pair m-n, if square m-n contains an X. 4. If any X’s were added on a previous pass, repeat with an additional pass. 5. In the final chart, each square with co-ords i-j which does not contain an X implies the equivalence of i and j. If desired, row matching can be used to partially reduce the state table before constructing the implication chart.
Equivalent Sequential Networks Equivalent by inspection of State Graphs
Equivalent Sequential Networks Second Pass e.g. Column A: compare row A in state table for N1 with each of the rows S0, S1…S3 in state table for N2