Download
1 / 42
510 likes | 1.59k Views
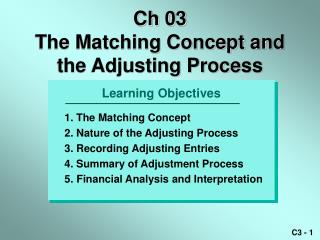
Ch 03 The Matching Concept and the Adjusting Process . 1. The Matching Concept 2. Nature of the Adjusting Process 3. Recording Adjusting Entries 4. Summary of Adjustment Process 5. Financial Analysis and Interpretation. Learning Objectives. Reporting Revenue and Expense. TWO METHODS.

E N D
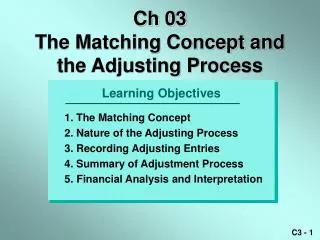
Ch 03 The Matching Concept and the Adjusting Process 1. The Matching Concept 2. Nature of the Adjusting Process 3. Recording Adjusting Entries 4. Summary of Adjustment Process 5. Financial Analysis and Interpretation Learning Objectives
Reporting Revenue and Expense TWO METHODS Cash Basis of Accounting Accrual Basis of Accounting
Cash Basis of Accounting • Revenue reported when cash is received • Expense reported when cash is paid • Does not properly match revenues and expenses
Accrual Basis of Accounting • Revenue reported when earned • Expense reported when incurred • Properly matches revenues and expenses in determining net income • Requires adjusting entries at end of period
The Matching Concept Debits = Credits Liabilities Assets Owner’s Equity Expenses Revenues
The Matching Concept Debits = Credits Liabilities Assets Owner’s Equity Net Income Expenses Revenues
The Matching Concept Debits = Credits Liabilities Assets Owner’s Equity Net Income Expenses Revenues matching Net income is determined by properly matching expenses and revenues.
NetSolutions Unadjusted Trial Balance December 31, 2002 11 Cash 2,065 12 Accounts Receivable 2,220 14 Supplies 2,000 15 Prepaid Insurance 2,400 17 Land 20,000 18 Office Equipment 1,800 Assets
NetSolutions Unadjusted Trial Balance December 31, 2002 11 Cash 2,065 12 Accounts Receivable 2,220 14 Supplies 2,000 15 Prepaid Insurance 2,400 17 Land 20,000 18 Office Equipment 1,800 21 Accounts Payable 900 23 Unearned Rent 360 Liabilities
NetSolutions Unadjusted Trial Balance December 31, 2002 11 Cash 2,065 12 Accounts Receivable 2,220 14 Supplies 2,000 15 Prepaid Insurance 2,400 17 Land 20,000 18 Office Equipment 1,800 21 Accounts Payable 900 23 Unearned Rent 360 31 Chris Clark, Capital 25,000 32 Chris Clark, Drawing 4,000 Owner’s Equity
NetSolutions Unadjusted Trial Balance December 31, 2002 11 Cash 2,065 12 Accounts Receivable 2,220 14 Supplies 2,000 15 Prepaid Insurance 2,400 17 Land 20,000 18 Office Equipment 1,800 21 Accounts Payable 900 23 Unearned Rent 360 31 Chris Clark, Capital 25,000 32 Chris Clark, Drawing 4,000 41 Fees Earned 16,340 Revenue
NetSolutions Unadjusted Trial Balance December 31, 2002 11 Cash 2,065 12 Accounts Receivable 2,220 14 Supplies 2,000 15 Prepaid Insurance 2,400 17 Land 20,000 18 Office Equipment 1,800 21 Accounts Payable 900 23 Unearned Rent 360 31 Chris Clark, Capital 25,000 32 Chris Clark, Drawing 4,000 41 Fees Earned 16,340 51 Wages Expense 4,275 52 Rent Expense 1,600 54 Utilities Expense 985 55 Supplies Expense 800 59 Miscellaneous Expense 455 42,600 42,600 Expenses
NetSolutions Unadjusted Trial Balance December 31, 2002 11 Cash 2,065 12 Accounts Receivable 2,220 14 Supplies 2,000 15 Prepaid Insurance 2,400 17 Land 20,000 18 Office Equipment 1,800 21 Accounts Payable 900 23 Unearned Rent 360 31 Chris Clark, Capital 25,000 32 Chris Clark, Drawing 4,000 41 Fees Earned 16,340 51 Wages Expense 4,275 52 Rent Expense 1,600 54 Utilities Expense 985 55 Supplies Expense 800 59 Miscellaneous Expense 455 42,600 42,600
NetSolutions Expanded Chart of Accounts Balance Sheet Income Statement 1. Assets 11 Cash 12 Accounts Receivable 14 Supplies 15 Prepaid Insurance 17 Land 18 Office Equipment 19 Accumulated Depreciation 2. Liabilities 21 Accounts Payable 22 Wages Payable 23 Unearned Rent 3. Owner’s Equity 31 Chris Clark, Capital 32 Chris Clark, Drawing 4. Revenue 41 Fees Earned 42 Rent Revenue 5. Expenses 51 Wages Expense 52 Rent Expense 53 Depreciation Expense 54 Utilities Expense 55 Supplies Expense 56 Insurance Expense 59 Miscellaneous Expense
NetSolutions Expanded Chart of Accounts Balance Sheet Income Statement 1. Assets 11 Cash 12 Accounts Receivable 14 Supplies 15 Prepaid Insurance 17 Land 18 Office Equipment 19 Accumulated Depreciation 2. Liabilities 21 Accounts Payable 22 Wages Payable 23 Unearned Rent 3. Owner’s Equity 31 Chris Clark, Capital 32 Chris Clark, Drawing 4. Revenue 41 Fees Earned 42 Rent Revenue 5. Expenses 51 Wages Expense 52 Rent Expense 53 Depreciation Expense 54 Utilities Expense 55 Supplies Expense 56 Insurance Expense 59 Miscellaneous Expense
NetSolutions Expanded Chart of Accounts Balance Sheet Income Statement 1. Assets 11 Cash 12 Accounts Receivable 14 Supplies 15 Prepaid Insurance 17 Land 18 Office Equipment 19 Accumulated Depreciation 2. Liabilities 21 Accounts Payable 22 Wages Payable 23 Unearned Rent 3. Owner’s Equity 31 Chris Clark, Capital 32 Chris Clark, Drawing 4. Revenue 41 Fees Earned 42 Rent Revenue 5. Expenses 51 Wages Expense 52 Rent Expense 53 Depreciation Expense 54 Utilities Expense 55 Supplies Expense 56 Insurance Expense 59 Miscellaneous Expense
NetSolutions Expanded Chart of Accounts Balance Sheet Income Statement 1. Assets 11 Cash 12 Accounts Receivable 14 Supplies 15 Prepaid Insurance 17 Land 18 Office Equipment 19 Accumulated Depreciation 2. Liabilities 21 Accounts Payable 22 Wages Payable 23 Unearned Rent 3. Owner’s Equity 31 Chris Clark, Capital 32 Chris Clark, Drawing 4. Revenue 41 Fees Earned 42 Rent Revenue 5. Expenses 51 Wages Expense 52 Rent Expense 53 Depreciation Expense 54 Utilities Expense 55 Supplies Expense 56 Insurance Expense 59 Miscellaneous Expense
NetSolutions Expanded Chart of Accounts Balance Sheet Income Statement 1. Assets 11 Cash 12 Accounts Receivable 14 Supplies 15 Prepaid Insurance 17 Land 18 Office Equipment 19 Accumulated Depreciation 2. Liabilities 21 Accounts Payable 22 Wages Payable 23 Unearned Rent 3. Owner’s Equity 31 Chris Clark, Capital 32 Chris Clark, Drawing 4. Revenue 41 Fees Earned 42 Rent Revenue 5. Expenses 51 Wages Expense 52 Rent Expense 53 Depreciation Expense 54 Utilities Expense 55 Supplies Expense 56 Insurance Expense 59 Miscellaneous Expense
Adjustments – Deferrals and Accruals Revenues Current Period Future Period Deferrals Cash Received Cash Received Revenue Recorded
Adjustments – Deferrals and Accruals Revenues Current Period Future Period Deferrals Cash Received Cash Received Revenue Recorded Accruals Revenue Recorded Cash Received
Adjustments – Deferrals and Accruals Revenues Current Period Future Period Deferrals Cash Received Cash Received Revenue Recorded Accruals Revenue Recorded Cash Received Expenses Current Period Future Period Deferrals Cash Paid Cash Paid Expense Recorded
Adjustments – Deferrals and Accruals Revenues Current Period Future Period Deferrals Cash Received Cash Received Revenue Recorded Accruals Revenue Recorded Cash Received Expenses Current Period Future Period Deferrals Cash Paid Cash Paid Expense Recorded Expense Recorded Cash Paid Accruals
Adjustments – Deferred Expense On December 1, NetSolutions purchased insurance for 24 months at a cost of $2,400. Example P1 – Purchase initially recorded as an asset. Adjustment A1 – Record insurance used for December, $100. Cash P1..... 2,400 Prepaid Insurance Assets P1..... 2,400 Insurance Expense Expenses
A1 A1 Adjustments – Deferred Expense On December 1, NetSolutions purchased insurance for 24 months at a cost of $2,400. Example P1 – Purchase initially recorded as an asset. Adjustment A1 – Record insurance used for December, $100. Cash P1..... 2,400 Prepaid Insurance Assets P1..... 2,400 A1..... 100 Insurance Expense A1.....100 Expenses
Adjustments – Deferred Expense On December 1, NetSolutions purchased insurance for 24 months at a cost of $2,400. Example P2 – Purchase initially recorded as an expense. Adjustment A2 – Record insurance unused as of December 31. Cash P2..... 2,400 Prepaid Insurance Assets Insurance Expense P2..... 2,400 Expenses
A2 A2 Adjustments – Deferred Expense On December 1, NetSolutions purchased insurance for 24 months at a cost of $2,400. Example P2 – Purchase initially recorded as an expense. Adjustment A2 – Record insurance unused as of December 31. Cash P2..... 2,400 Prepaid Insurance Assets A2..... 2,300 Insurance Expense P2..... 2,400 A2.....2,300 Expenses
Adjustments – Deferred Revenue On December 1, NetSolutions received cash of $360 for three months’ rent beginning December 1. Example S1 – Sale initially recorded as a liability. Adjustment A3 – Record rent earned for December. Cash S1..... 360 Unearned Rent Liabilities S1..... 360 Rent Revenue Revenues
A3 A3 Adjustments – Deferred Revenue On December 1, NetSolutions received cash of $360 for three months’ rent beginning December 1. Example S1 – Sale initially recorded as a liability. Adjustment A3 – Record rent earned for December. Cash S1..... 360 Unearned Rent Liabilities A3..... 120 S1..... 360 Rent Revenue A3.....120 Revenues
Adjustments – Deferred Revenue On December 1, NetSolutions received cash of $360 for three months’ rent beginning December 1. Example S2 – Sale initially recorded as revenue. Adjustment A4 – Record rent unearned as of December 31. Cash S2..... 360 Unearned Rent Liabilities Rent Revenue S2.....360 Revenues
A4 A4 Adjustments – Deferred Revenue On December 1, NetSolutions received cash of $360 for three months’ rent beginning December 1. Example S2 – Sale initially recorded as revenue. Adjustment A4 – Record rent unearned as of December 31. Cash S2..... 360 Unearned Rent Liabilities A4..... 240 Rent Revenue A4..... 240 S2.....360 Revenues
Adjustments – Accrued Expense NetSolutions received employee services for the last two days of December amounting to $250, to be paid later. Adjustment A5 – Record accrued wages of $250. Wages Payable Liabilities Wages Expense Bal.....4,275 Expenses
A5 A5 Adjustments – Accrued Expense NetSolutions received employee services for the last two days of December amounting to $250, to be paid later. Adjustment A5 – Record accrued wages of $250. Wages Payable Liabilities A5..... 250 Wages Expense Bal.....4,275 Expenses A5.....250
Adjustments – Accrued Revenue As of December 31, NetSolutions provided 25 hours of services at $20 per hour to be billed next month. Adjustment A6 – Record accrued fees earned of $500. Accounts Receivable Assets Bal.....2,220 Fees Earned Bal....16,340 Revenues
A6 A6 Adjustments – Accrued Revenue As of December 31, NetSolutions provided 25 hours of services at $20 per hour to be billed next month. Adjustment A6 – Record accrued fees earned of $500. Accounts Receivable Assets Bal.....2,220 A6..... 500 Fees Earned Bal....16,340 Revenues A6.....500
A1 A2 Summary of Adjustments Buying Side Deferred Expenses Assets Expenses Rearranging the Debits
A1 A2 A3 A4 Summary of Adjustments Buying Side Selling Side Deferred Expenses Deferred Revenues Assets Liabilities Expenses Revenues Rearranging the Debits Rearranging the Credits
A5 Summary of Adjustments Buying Side Selling Side Accrued Expenses Liabilities Expenses Adding a New Transaction
A5 A6 Summary of Adjustments Buying Side Selling Side Accrued Expenses Accrued Revenues Liabilities Assets Expenses Revenues Adding a New Transaction Adding a New Transaction
A1 A2 A5 A3 A4 A6 Summary of Adjustments Buying Side Selling Side Deferred Expenses Accrued Expenses Deferred Revenues Accrued Revenues Assets Liabilities Liabilities Assets Expenses Expenses Revenues Revenues Rearranging the Debits Adding a New Transaction Rearranging the Credits Adding a New Transaction
Financial Analysis and Interpretation Comparative Income StatementsFor the Years Ended December 31, 2003 and 2002 Objective: Use vertical analysis to compare financial statement items with each other and with industry averages. Fees earned $ 187,500 100.0% $ 150,000 100.0% Operating expenses: Wages expense $ 60,000 32.0% $ 45,000 30.0% Rent expense 15,000 8.0 2003 2002 Amount Percent Amount Percent Vertical Analysis: Wages expense $ 60,000 Fees earned $ 187,500 = 32.0%
HOME WORK READING: • Illustrative problem • Self- examination questions • Multiple choice Writing: • Exercise 3-1; 3-17; • Problem 3-5A; 3-6B Discussion: • Activity 3-4 Eminent television repair