Download
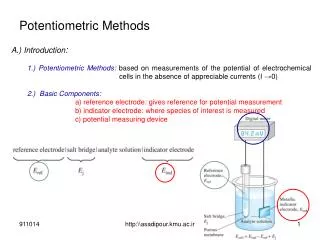
1 / 8
80 likes | 221 Views
Annexin V. Phosphatidylserine. Cytotoxicity. CTL. PKH-26. Fischer at al. J Immunol Methods 2002, 259:159-69

E N D
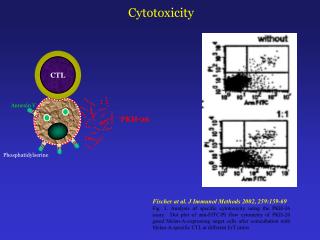
Annexin V Phosphatidylserine Cytotoxicity CTL PKH-26 Fischer at al. J Immunol Methods 2002, 259:159-69 Fig. 3. Analysis of specific cytotoxicity using the PKH-26 assay. Dot plot of ann-FITC/PI flow cytometry of PKH-26 gated Melan-A-expressing target cells after coincubation with Melan-A-specific CTL at different ErT ratios
CD4 HIV-DNA In-situ Hybridisation PCR IN-SITU HYBRIDISATION Patterson at al. J Virol 1995, 69: 4316–4322. Fig. 2. Comparison of representative two-color dot plots of monocyte-depleted PBMCs from patients with varying CD4
Nuclear translocation NP-40 Blaecke et al. Cytometry 2002, 48: 71–79 Fig. 6. Measurement of NF–B translocation by flow cytometry. Dose-response curve of NF-B translocation after 30 min of LPS treatment of human DCs. Results are expressed as the mean values of MFI, taken from FACS histograms and the SDs were obtained from five experiments
BCG_FITC FL2 (PE) binded internalized aBCG_PE FL1 (FITC) Binding & Internalization de Boer EC et al. Cytometry 1996; 25: 381-7 Fig. 1. Green (El, X-axis) vs. red (FL2, Y-axis) fluorescence, showing BCG internalization and binding by T24 bladder carcinoma cells. Incubation of R4 cells with fluoresceinated BCG (10 clu BCG/cell) for a duration of 4 h and subsequent labeling with anti-BCG and PE-conjugated second antibody: FLl +m2- cells (quadrant 4) represent BCG-internalizing cells, FLl+/FL2+ cells (quadrant 3) represent BCG-binding cells.
in vitro compartmentalization (IVC) using water-in-oil emulsions Biotinilated Substrate Translation Sorting Product Avidin PCR Isolation of genes from libraries Griffiths at al. EMBO J. (2003); 22: 24–35 Fig. 5 After fluorescent labelling using anti-product antibodies the beads were analysed by flow cytometry. The levels of fluorescence (FL1-H) on single unsorted beads are plotted as histograms. The 'positive' highly fluorescent beads (in region M1) were sorted from the 'negative' low-fluorescence beads and re-analysed. The genes on the sorted 'positive' beads (and on unsorted beads) were PCR amplified and analysed by agarose gel electrophoresis
TerminalTransferase Douglas RS at al. Cytometry 1998; 32: 57-65 Fig. 3. Evaluation of B- and T-cell apoptosis after LPS activation. /*/. A: Identification of B (54%; B220/CD5-) and T (30%; B220-/CD5) cells after culture/*/ F: Apoptosis (FL-4 fluorescence) and DNA cell cycle, with 11% of the B-cell population apoptotic and in the G0/G1 cell cycle phase and 1% of the B-cell population apoptotic and in the S and G2/M cell cycle phases. D: DNA cell cycle histogram of B cells using DAPI staining, showing 82% in the G0/ G1 DNA dommage TdT- mediated dUTP nick end labelling TUNEL DAPI
Morgan at al. Clin Immunol 2004; 110: 252– 266 Fig. 5. Cytokine responses in nasal lavage from an asthma patient to Rhinovirus-16 inoculation. Specimens were collected on day 0 (before viral inoculation) and 2, 4, and 7 days after inoculation. A 4-plex cytokine CBA assay, consisting of IL-1h, IL-8, GM-CSF, and IL-6 beads was used for these samples. Detectable cytokine concentration changes were observed after Rhinovirus-16 inoculation. Cytokines dosage
FRET mRNA Abe et al. PNAS 2006; 103: 263-8 Fig. 3. Detection of GAPDH mRNA and 28S rRNA in living HL-60 cells by FC. QFRET probe sequences are shown. The control probe pair consisted of donor probe for 28S rRNA and acceptor probe for GAPDH. HL-60 cells permeabilized by SLO were incubated with QFRET probes (200 nM) in PBS buffer (pH 7.0) for 1.5 h. The resulting cell suspension (n 50,000) was directly analyzed by FC as described in Materials and Methods.(A and B) Histograms showing cell-count frequency vs. FRET intensity for each probe sequence Detection of mRNA