Download
1 / 18
180 likes | 204 Views
This research provides a long-term sea surface climatology using Landsat thermal infrared data, offering high spatial resolution insights. Learn about the climatology construction, temperature validation, anomalous data, and diverse applications presented in this study.

E N D
High spatial resolution sea surface climatology from Landsat thermal infrared data Jeremy Fisher & John Mustard Geological Sciences - Brown University November 2004
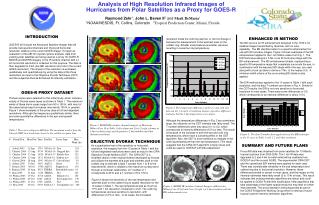
Scene Location Narragansett Bay
Climatologies • A climatololgy – the annual cycle of sea surface temperature (SST) • Term not often associated with estuarine and near-coastal studies • In situ SST collection is either cross sectional or time series, rarely gridded • Thus, SST static in time, or compared across space with few points • This research provides a long term climatology to accurately fill the space between in situ sites (interpolation field) Providence Conimicut Pt. Fall River Quonset Prudence Newport
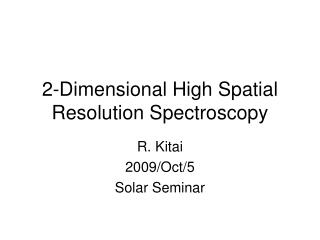
Advanced Very High Resolution Radiometer - Global Climatology • Climatology interpolated from 14 years of daily SST observations into single “average” yearly cycle • Data distillation Degrees Celsius Julian Date PO.DAAC SST, JPL Climatology [1985-1999]
Landsat Thematic Mapper (TM) 16 day repeat time (vs. daily) Sparse coverage (vs. global) High resolution 60 meter (Landsat 5) 120 meter (Landsat 7) AVHRR Advanced Very High Resolution Radiometer A question of resolution.. Landsat Thematic Mapper
Temperature / satellite observations • Collected 52 satellite thermal images • Landsat Thematic Mapper (4,5,&7) from 1984 to 2002 • Use infrared to measure the temperature at the water surface • Surface and body temperatures are similar at this time of the day (10:00 AM EST) • Correct and validate temperatures against in situ sites
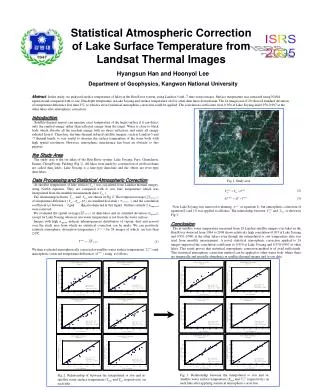
12th order Polynomial fit Anomalous Data Standard Deviation Clouds Climatology construction Temperature (Degrees C) Calendar Day
Maximum temperature Date of Max temperature Date of Min temperature Minimum temperature Climatology construction
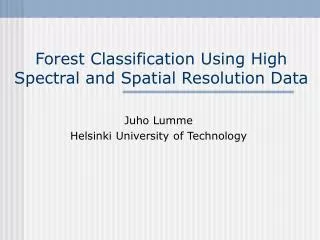
15 24 Degrees C Maximum Temperature
-2 7 Degrees C Minimum Temperature
30 C Maximum temperature 18 C Maximum day 200 240 Mt. Hope Bay anomaly: Temperature is higher then Expected
Conclusion • Applications • Use as an interpolation field for existing in situ records • Anomaly detection (Mt. Hope Bay) • Prediction of eelgrass growth suitability • Circulation patterns and timing of transitions • Comparison of water bodies over broad spaces • New process • Patterns inferred, but not previously observed • New applications • More information • http://porter.geo.brown.edu/~jfisher • Fisher and Mustard, 2004. High spatial resolution sea surface climatology from Landsat thermal infrared data. Remote Sensing of Environment. 90 293-307
Verification of Climatology Results Satellite maximum and minimum temperature Date of Satellite maximum and minimum temperature Date of In situ maximum and minimum temperature In situ maximum and minimum temperature