Download

1 / 18
200 likes | 431 Views
Coastal Structures 2007, Venice Burcharth, H. F., Aalborg University, Denmark Lykke Andersen, T., Aalborg University, Denmark. Scale effects related to small scale physical modelling of overtopping of rubble mound breakwaters. Contents. The problem Scale and model effects

E N D
Coastal Structures 2007, Venice Burcharth, H. F., Aalborg University, Denmark Lykke Andersen, T., Aalborg University, Denmark Scale effects related to small scale physical modelling of overtopping of rubble mound breakwaters
Contents • The problem • Scale and model effects • Experimental set-up • Verification of scaling of model experiments • Video from experiments • Results and conclusion
The problem • Admissible overtopping of breakwaters is an important design parameter as it - roughly speaking - determines the crest level. • In case of roads, sheds, storage areas etc. just behind the structure we are dealing with very small limiting overtopping discharges characterized by average values less than 1 litre/sm. • The EU-CLASH project showed that normal size small scale rubble mound models under estimate smaller overtopping discharges compared to prototype measurements. app. 1 l/sm Comparison of model and prototype overtopping for antifer cube armoured breakwater at Zeebrugge (CLASH, 2006)
The problem • Note that small overtopping discharges are caused by very few waves in a storm. • Therefore, important to model these few waves kinematically and statistically correct.
Scale and model effects Deviations between model and prototype results are due to scale and model effects Scale effects due to incorrect reproduction of ratios between forces in the model
Scale and model effects • Model effects • Deviations in wave kinematics (directionality, wave height distribution, succession of waves, degree of instability) • Methods in wave recording (pressure gauge, accelerometer buoy, acoustic, staff) • Methods of wave analysis • Geometrical differences (width of overtopping tanks, sea bed topography, ……) • Lack of wind and currents • Impossible to separate and quantify scale and model effects for small overtopping discharges by comparing model and prototype results.
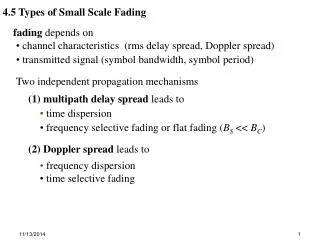
Flow regimes Some scale effects can be studied by comparing small and large scale models (typical length scale ratios 1:5 – 1:10) because similar incident waves or flows can be generated due to the controlled environment. Regimes of scale effects in run-up on rubble slopes: The run-up height determines the overtopping. The CLASH project showed bigger overtopping deviations between model and prototype for flatter slopes. This could be due to increased flow resistance in the upper part of the run-up wedge. Here the run-up has the characteristics of a flow between obstacles for which drag coefficients can be very dependent on the Reynolds number. Illustration of surface flow and porous flow domains during run-up (Burcharth, 2004)
Investigation of scale effects in the upper part of the run-up wedge by physical models Reynolds effect The larger the drag force on the armour the smaller will be the run-up. The drag coefficients in Morison and Forcheimer equations decreases with increasing Reynolds number in the actual range of fully turbulent flow. As the reduction in drag coefficients are less for sharp edged objects it was chosen to use cubes as armour elements in order to demonstrate a lower limit for the scale impact. Consequently, the scale effect on rock armour is expected to be larger than seen in the present tests. Schematic illustration of drag variation with Reynolds’ number
Investigation of scale effects in the upper part of the run-up wedge by physical models Surface tension effect The surface tension is relatively much smaller in large scale models and prototypes than in the small scale models. This cause very different air bubble structures with many more smaller air bubbles in larger scale models and especially in salt water prototypes (Bullock et al., 2001) The Reynolds and surface tension scale effects cannot be separated in the tests.
Test set-up A jet-like up-slope flow on a cube armoured impermeable ramp was generated by instant removal of a hatch to a reservoir. Two geometrically absolute similar models of length ratio 1:5 were used: Porosity = 0.42 Width between cubes = 0.3 L
Determination of minimum size of model The flow must imitate as closely as possible wave run-up on an armour slope. Critical Reynolds’ number for armour stability: Outflow from reservoir: with small scale cube side length l = 18 mm and = 10-6 m2/s => head h in reservoir 0.193 m
Scaling law for initial outflow of reservoir For the instant flow through the sharp edge hatch opening only gravity and inertia forces dominates (Froude model) when according to Hager (1998) the hatch opening time top 1.25(h/g)0.5, which
Photos of max run-up Small scale Large scale
The run-up tongue reaches 3 cube length further in the large model than in the small model. The vertical run-up height is 1L larger in the large scale model than in the small scale model. This shows a significant scale effect solely related to run-up in the upper part of the wedge and probably explain to a large extent why small scale models underpredict small overtopping discharges. Equivalent changes in run-up correspond to typical overtopping discharges is increased by approximately a factor of 5 to 10 in a large scale model. Results and conclusions
h = 9 m Hs = 5 m s0p = 0.04 L = 2 m (KD = 4) Gc = 3L = 6 m Slope 1:2 Ac = Rc = 6.5 m => q = 1 l/sm (CLASH NN) Ac = Rc = 4.4 m => q = 10 l/sm (CLASH NN) Ac,Rc increased by 1 L Ac = Rc = 8.5 m => q = 0.15 l/sm (CLASH NN) Ac = Rc = 6.4 m => q = 1.1 l/sm (CLASH NN) Difference in mean overtopping discharge equivalent to run-up height difference L