CHAPTER 8TN Process Capability and Statistical Quality Control
CHAPTER 8TN Process Capability and Statistical Quality Control. Process Variation Process Capability Process Control Procedures Acceptance Sampling. Types of Statistical Quality Control. Basic Forms of Variation. Assignable variation Common variation. High. High. Incremental Cost of

CHAPTER 8TN Process Capability and Statistical Quality Control
E N D
Presentation Transcript
CHAPTER 8TNProcess Capability and Statistical Quality Control • Process Variation • Process Capability • Process Control Procedures • Acceptance Sampling
Basic Forms of Variation • Assignable variation • Common variation
High High Incremental Cost of Variability Incremental Cost of Variability Zero Zero Lower Spec Target Spec Upper Spec Lower Spec Target Spec Upper Spec Traditional View Taguchi’s View Taguchi’s View of Variation
Process Capability • Process limits • Tolerance limits • How do the limits relate to one another?
Process Capability Index, Cpk Capability Index shows how well parts being produced fit into design limit specifications. As a production process produces items small shifts in equipment or systems can cause differences in production performance from differing samples. Shifts in Process Mean
Types of Statistical Sampling • Attribute (Go or no-go information) • Defectives refers to the acceptability of product across a range of characteristics. • Defects refers to the number of defects per unit which may be higher than the number of defectives. • Variable (Continuous) • Usually measured by the mean and the standard deviation.
UCL Statistical Process Control (SPC) Charts Normal Behavior LCL 1 2 3 4 5 6 Samples over time UCL Possible problem, investigate LCL 1 2 3 4 5 6 Samples over time UCL Possible problem, investigate LCL 1 2 3 4 5 6 Samples over time
Control Limits are based on the Normal Curve x m z -3 -2 -1 0 1 2 3 Standard deviation units or “z” units.
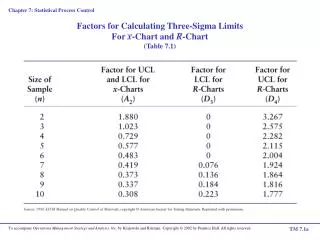
x LCL UCL Control Limits We establish the Upper Control Limits (UCL) and the Lower Control Limits (LCL) with plus or minus 3 standard deviations. Based on this we can expect 99.7% of our sample observations to fall within these limits. 99.7%
STANDARD DEVIATION TABLE % Data Points # of Std Dev From Mean ------------------- --------------------------------- 68 95 95.5 99 99.7
Statistical Process Control Formulas:Attribute Measurements (p-Chart) Given: Compute control limits:
Example of Constructing a p-chart: Step 1 1. Calculate the sample proportions, p (these are what can be plotted on the p-chart) for each sample.
Example of Constructing a p-chart: Steps 2&3 2. Calculate the average of the sample proportions. 3. Calculate the standard deviation of the sample proportion
Example of Constructing a p-chart: Step 4 4. Calculate the control limits.
0.1 0.09 0.08 0.07 0.06 p 0.05 0.04 0.03 0.02 0.01 0 1 2 3 4 5 6 7 8 9 10 11 12 13 14 15 Observation Example of Constructing a p-Chart: Step 5 5. Plot the individual sample proportions, the average of the proportions, and the control limits
R Chart • Type of variables control chart • Interval or ratio scaled numerical data • Shows sample ranges over time • Difference between smallest & largest values in inspection sample • Monitors variability in process • Example: Weigh samples of coffee & compute ranges of samples; Plot
R Chart Control Limits From Table Sample Range at Time i # Samples
R Chart Example You’re manager of a 500-room hotel. You want to analyze the time it takes to deliver luggage to the room. For 7 days, you collect data on 5 deliveries per day. Is the process in control?
R Chart Hotel Data Sample DayDelivery TimeMean Range 1 7.30 4.20 6.10 3.45 5.55 2 4.60 8.70 7.60 4.43 7.62 3 5.98 2.92 6.20 4.20 5.10 4 7.20 5.10 5.19 6.80 4.21 5 4.00 4.50 5.50 1.89 4.46 6 10.10 8.10 6.50 5.06 6.94 7 6.77 5.08 5.90 6.90 9.30
Sample Range = 7.30 - 3.45 R Chart Hotel Data Sample DayDelivery TimeMean Range 1 7.30 4.20 6.10 3.45 5.55 5.32 3.85 Largest Smallest
7.30 + 4.20 + 6.10 + 3.45 + 5.55 5 Sample Mean = R Chart Hotel Data Sample DayDelivery TimeMean Range 1 7.30 4.20 6.10 3.45 5.55 5.32
R Chart Hotel Data Sample DayDelivery Time Mean Range 1 7.30 4.20 6.10 3.45 5.55 5.32 3.85 2 4.60 8.70 7.60 4.43 7.62 6.59 4.27 3 5.98 2.92 6.20 4.20 5.10 4.88 3.28 4 7.20 5.10 5.19 6.80 4.21 5.70 2.99 5 4.00 4.50 5.50 1.89 4.46 4.07 3.61 6 10.10 8.10 6.50 5.06 6.94 7.34 5.04 7 6.77 5.08 5.90 6.90 9.30 6.79 4.22
Example of R charts: From Exhibit TN7.7
`X Chart • Type of variables control chart • Shows sample means over time • Monitors process average • Example:
`X Chart Control Limits From Exhibit 7.7TN(n = 5) Sample Mean at Time i Sample Range at Time i # Samples
Alone Group Class `X Chart Example You’re manager of a 500-room hotel. You want to analyze the time it takes to deliver luggage to the room. For 7 days, you collect data on 5 deliveries per day. Is the process in control?
X Chart Hotel Data Sample DayDelivery TimeMean Range 1 7.30 4.20 6.10 3.45 5.55 5.32 3.85 2 4.60 8.70 7.60 4.43 7.62 6.59 4.27 3 5.98 2.92 6.20 4.20 5.10 4.88 3.28 4 7.20 5.10 5.19 6.80 4.21 5.70 2.99 5 4.00 4.50 5.50 1.89 4.46 4.07 3.61 6 10.10 8.10 6.50 5.06 6.94 7.34 5.04 7 6.77 5.08 5.90 6.90 9.30 6.79 4.22
Example of x-bar charts: Tabled Values From Exhibit TN7.7
Example of x-bar charts: Tabled Values From Exhibit TN7.7
`X ChartControl Chart Solution* UCL LCL
Process Capability • TQM’s emphasis on “making it right the first time” has resulted in organizations emphasizing the ability of a production system to meet design specifications rather than evaluating the quality of outputs after the fact with acceptance sampling. • Process Capability -
Process Capability • Process limits – • Tolerance limits -
1. Make bigger 2. Make smaller Process Capability • How do the limits relate to one another? You want: tolerance range > process range Two methods of accomplishing this:
Process Capability Measurement • Cp index = Tolerance range / Process range • What value(s) would you like for Cp? • Larger Cp – • The Cp index • Assumes
Process Capability Depends On: • Location of the process mean. • Natural variability inherent in the process. • Stability of the process. • Product’s design requirements.
Process Capability Index Cp< 1: Cp> 1: As rule of thumb, many organizations desire a Cp index of at least 1.5. Six sigma quality(fewer than 3.4 defective parts per million) corresponds to a Cp index of 2.
UTL LTL
Process Capability Light-bulb Production Upper specification = 120 hours Lower specification = 80 hours Average life = 90 hours s = 4.8 hours UTL - LTL 6s CP = Process Capability Ratio
Process Capability Light-bulb Production CP = Process Capability Ratio
= estimate of theprocess mean Cpk Index s= estimate of thestandard deviation Together, these process capability Indices show how well parts being produced conform to design specifications.
Another example of the use of process capability indices The design specifications for a machined slot is 0.5± .003 inches. Samples have been taken and the process mean is estimated to be .501. The process standard deviation is estimated to be .001. What can you say about the capability of this process to produce this dimension?
Basic Forms of Statistical Sampling for Quality Control • Sampling to accept or reject the immediate lot of product at hand (Acceptance Sampling). • Sampling to determine if the process is within acceptable limits (Statistical Process Control)


![Seven Quality Tools [Statistical Process Control]](https://cdn3.slideserve.com/6416179/seven-quality-tools-statistical-process-control-dt.jpg)