Chapter 7: Statistical Process Control
Chapter 7: Statistical Process Control. Factors for Calculating Three-Sigma Limits For x -Chart and R -Chart (Table 7.1). TM 7.1a. Chapter 7: Statistical Process Control. Webster Chemical Filling Process. TM 7.1b. Chapter 7: Statistical Process Control. Webster Chemical Filling Process

Chapter 7: Statistical Process Control
E N D
Presentation Transcript
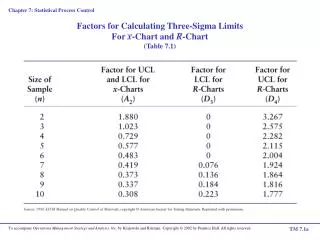
Chapter 7: Statistical Process Control Factors for Calculating Three-Sigma Limits For x-Chart and R-Chart (Table 7.1) TM 7.1a
Chapter 7: Statistical Process Control Webster Chemical Filling Process TM 7.1b
Chapter 7: Statistical Process Control Webster Chemical Filling Process Sample 6 Data Deleted TM 7.1c
Chapter 7: Statistical Process Control Webster Chemical Capping Process Number of defective tubes in a box of 144 TM 7.2a
Chapter 7: Statistical Process Control p-Chart for Mastics and Caulking sp TM 7.2b
Chapter 7: Statistical Process Control Webster Chemical Caulking Defects TM 7.3
Chapter 7: Statistical Process Control Webster Chemical Process Capability TM 7.4