Download
1 / 19
190 likes | 356 Views
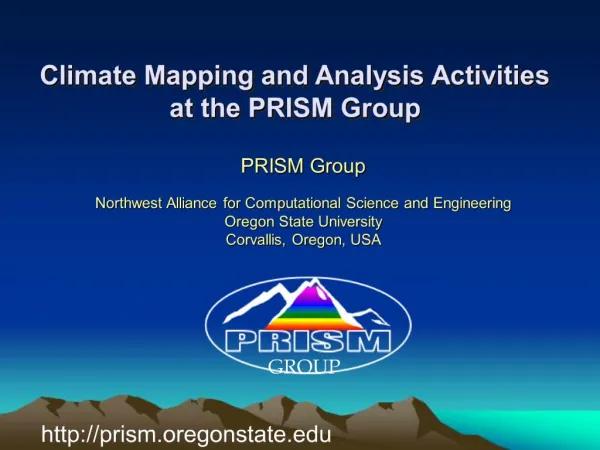
Climate Mapping and Analysis Activities at the PRISM Group. PRISM Group Northwest Alliance for Computational Science and Engineering Oregon State University Corvallis, Oregon, USA. PRISM. GROUP. http://prism.oregonstate.edu. PRISM. GROUP. PRISM Group

E N D
Climate Mapping and Analysis Activities at the PRISM Group PRISM Group Northwest Alliance for Computational Science and Engineering Oregon State University Corvallis, Oregon, USA PRISM GROUP http://prism.oregonstate.edu
PRISM GROUP PRISM Group • 5-FTE applied research team at Oregon State University, 100% externally funded • The PRISM Group is the only center in the world dedicated solely to the spatial analysis of climate • PRISM climate mapping technology has been continuously developed, and repeatedly peer-reviewed, since 1991 • The PRISM Group is the de facto climate mapping center for the US • The PRISM Group is advancing “Geospatial Climatology” as an emerging discipline
PRISM Parameter-elevation Regressions on Independent Slopes Model • Generates gridded estimates of climatic parameters (e.g., P, T, DP) • Moving-window regression of climate/weather values vs. elevation or climatology for each grid cell • Uses nearby station observations • Spatial climate knowledge base weights stations in the regression function by their physiographic similarity to the target grid cell
PRISM PRISM spatial climate knowledge base accounts for spatial variations in climate due to: • Elevation • Terrain orientation – rain shadows • Terrain profile – terrain enhancement of precipitation • Moisture regime – exposure to moisture sources • Coastal proximity – marine air intrusion • Two-layer atmosphere – inversion layer, free atmosphere • Topographic position – susceptibility to cold air pooling
PRISM Spatial Climate Datasets All data sets are state-of-the-art, and are used as the standard for evaluation of other methods 50 US States & Poss. Mongolia China Western Canada Taiwan Caribbean Islands
New Official US Plant Hardiness Map (USDA) Over 1,000 SCAS Maps • Mean lowest temperature of the year • Used by seed producers, nurseries, and gardeners to determine plant suitability • The most heavily used climate map in the country • Quality substantially better than 1990 map • Averaging period is subject of controversy
CONUS 1895-Present Monthly Climate Time Series • Tmax, tmin, precip, dew point • 4-km grid resolution, work under way on an 800-m version • At each grid cell, provides realistic historical values and variability
Use of National and Regional PRISM Data Sets • Official spatial climate data sets of the USDA • Climate monitoring and future projections • Retrospective analyses • National Weather Service Forecasts • Weather Channel Forecasts • Thousands of users, both public and private, who require high-quality spatial climate analyses
Small-Scale Climate Research : Upper South Santiam River Watershed
Upper South Santiam River Watershed 4 October 2003
Climate Research at the HJ Andrews Experimental Forest LTER Site 1278 m 442 m
Lapse rate depends strongly on weather pattern • Spatial temperature patterns depend strongly on lapse rate • Changes in frequency of weather patterns create changes in the spatial patterns of temperature Flow Strength L = Low M = Medium H = High Cloudy & windy Clear & calm Anti-cyclonic Zonal Cyclonic
1971-2000 July Tmax Temperature Patterns Conditioned on 700-mb Flow Strength and Curvature Corvallis – Newport = 10.8C Corvallis – Newport = 3.8C N C N C
PRISM Probabilistic-Spatial QC (PSQC) System for SNOTEL Data Provides a continuous, quantitative confidence probability for each observation, estimates a replacement value, and provides a confidence interval for that replacement. • Start with daily max/min temperature for all SNOTEL sites, period of record • Move to precipitation, SWE, soil temperature and moisture • Develop automated system for near-real time operation at NRCS
Some New Projects… Preliminary solar radiation mapping for Oregon (pending) Sun Grant GIS biomass inventory ODA pinning maps and Internet mapserver Alaska climate mapping Downscaling climate to 80-m resolution 800-m time series climate mapping (ARSC) http://prism.oregonstate.edu