Download
1 / 60
600 likes | 728 Views
The PRISM (Parameter-elevation Regressions on Independent Slopes Model) technique, spearheaded by the Spatial Climate Analysis Service (SCAS) at Oregon State University, provides innovative spatial climate products that are essential for understanding climate patterns in complex regions. Since 1991, PRISM's peer-reviewed methodologies have set the standard in climate mapping, combining expert knowledge with automated techniques to deliver credible climatic data, including precipitation and temperature estimates. This approach uniquely integrates human expertise with scientific rigor, facilitating significant advancements in geospatial climatology.

E N D
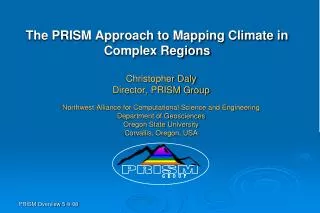
The PRISM Approach to Mapping Climate in Complex Regions Christopher Daly Director Spatial Climate Analysis Service Oregon State University Corvallis, Oregon
Spatial Climate Analysis Service Mission • Service • Provide innovative, state-of-the science spatial climate products and services to clients worldwide • Research • Maintain scientific research and development programs that provide the basis for products and services • Education • Advance “geospatial climatology” as an emerging discipline
SCAS and PRISM are Unique • SCAS is the only center in the world dedicated solely to the mapping of climate • PRISM climate mapping technology has been continuously developed, and repeatedly peer-reviewed, since 1991 • PRISM climate maps are the “gold standard” by which others are evaluated • SCAS has become a leader in climate mapping products and technology worldwide
Rationale • Observations are rarely sufficient to directly represent the spatial patterns of climate • Human-expert mapping methods often produce the best products, but are slow, inconsistent, and non-repeatable • Purely statistical mapping methods are fast and repeatable, but rarely provide the best accuracy, detail, and realism • Therefore… • The best method may be a statistical approach that is automated, but developed, guided and evaluated with expert knowledge
Knowledge-Based SystemKBS • Knowledge acquisition capability – Elicit expert information • Knowledge base – Store of knowledge • Inference Engine – Infer solutions from stored knowledge • User interface – Interaction and explanation • Independent verification – Knowledge refinement
PRISM • Generates gridded estimates of climatic parameters • Moving-window regression of climate vs. elevation for each grid cell • Uses nearby station observations • Spatial climate knowledge base weights stations in the regression function by their climatological similarity to the target grid cell Parameter-elevation Regressions on Independent Slopes Model
Oregon Annual Precipitation Interface
PRISM Knowledge Base • Elevation Influence on Climate
1961-90 Mean January Precipitation, Sierra Nevada, CA, USA Oregon Annual Precipitation
1961-90 Mean August Max Temperature, Sierra Nevada, CA, USA Oregon Annual Precipitation
1961-90 Mean September Max Temperature, Qin Ling Mountains, China Oregon Annual Precipitation
PRISM Moving-Window Regression Function 1961-90 Mean April Precipitation, Qin Ling Mountains, China Weighted linear regression
Governing Equation Moving-window regression of climate vs elevation y = 1x + 0 Y = predicted climate element x = DEM elevation at the target cell 0 = y-intercept 1 = slope x,y pairs - elevation and climate observations from nearby climate stations
Station Weighting Combined weight of a station is: W = f {Wd, Wz, Wc, Wf, Wp, Wl, Wt, We} • Distance • Elevation • Clustering • Topographic Facet (orientation) • Coastal Proximity • Vertical Layer (inversion) • Topographic Index (cold air pooling) • Effective Terrain Height (orographic profile)
PRISM • Terrain-Induced Climate Transitions (topographic facets, moisture index) Knowledge Base • Elevation Influence on Climate
Rain Shadow: 1961-90 Mean Annual Precipitation Oregon Cascades Portland Mt. Hood Eugene Dominant PRISM KBS Components Elevation Terrain orientation Terrain steepness Moisture Regime Mt. Jefferson 2500 mm/yr 2200 mm/yr Sisters Three Sisters 350 mm/yr Redmond N Bend
Olympic Peninsula, Washington, USA Flow Direction
Topographic Facets = 4 km = 60 km
Mean Annual Precipitation, 1961-90 Oregon Annual Precipitation Max ~ 7900 mm Full Model 3452 mm 3442 mm 4042 mm Max ~ 6800 mm
Mean Annual Precipitation, 1961-90 Max ~ 4800 mm 3452 mm 3442 mm 4042 mm Facet Weighting Disabled
Mean Annual Precipitation, 1961-90 Oregon Annual Precipitation Max ~ 3300 mm 3452 mm 3442 mm 4042 mm Elevation = 0
Mean Annual Precipitation, 1961-90 Oregon Annual Precipitation Max ~ 7900 mm Full Model 3452 mm 3442 mm 4042 mm Max ~ 6800 mm
PRISM • Terrain-Induced Climate Transitions (topographic facets, moisture index) Knowledge Base • Elevation Influence on Climate • Coastal Effects
Coastal Effects: 1971-00 July Maximum Temperature Central California Coast – 1 km Sacramento Stockton Dominant PRISM KBS Components Elevation Coastal Proximity Inversion Layer 34° SanFrancisco Oakland Fremont SanJose Preferred Trajectories Santa Cruz 27° 20° Pacific Ocean Hollister Monterey Salinas N
1961-90 Mean July Maximum Temperature, Central California, USA Coastal Proximity Weighting OFF Coastal Proximity Weighting ON
PRISM • Terrain-Induced Climate Transitions (topographic facets, moisture index) Knowledge Base • Elevation Influence on Climate • Coastal Effects • Two-Layer Atmosphere and Topographic Index
1971-2000 January Temperature, HJ Andrews Forest, Oregon, USA TMAX-Elevation Plot for January Layer 1 Layer 2 TMIN-Elevation Plot for January Layer 1 Layer 2
Central Colorado Terrain and Topographic Index Gunnison Gunnison Terrain Topographic Index
January Minimum Temperature Central Colorado Gunnison Gunnison Valley Bottom Elev = 2316 m Below Inversion Lapse = 5.3°C/km T = -16.2°C
January Minimum Temperature Central Colorado Gunnison Mid-Slope Elev = 2921 m Above Inversion Lapse = 6.9°C/km T = -12.7°C
January Minimum Temperature Central Colorado Gunnison Ridge Top Elev = 3779 m Above Inversion Lapse = 6.0°C/km T = -17.9°C
Inversions – 1971-00 January Minimum Temperature Central Colorado N Dominant PRISM KBS Components Elevation Topographic Index Inversion Layer Taylor Park Res. Crested Butte -18° Gunnison -13° -18°C Lake City