Terrain Mapping and Analysis
220 likes | 1.15k Views
Terrain Mapping and Analysis. Chapter 12. Introduction. Terrain mapping Land surface is 3-D Elevation data or z-data is treated as a cell value or a point data attribute rather than as a coordinate. Data for Terrain Mapping and Analysis. Digital Elevation Model (DEM)

Terrain Mapping and Analysis
E N D
Presentation Transcript
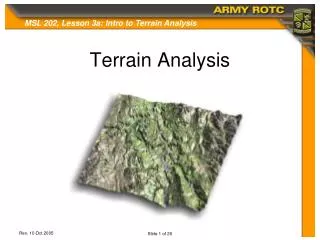
Terrain Mapping and Analysis Chapter 12
Introduction • Terrain mapping • Land surface is 3-D • Elevation data or z-data is treated as a cell value or a point data attribute rather than as a coordinate.
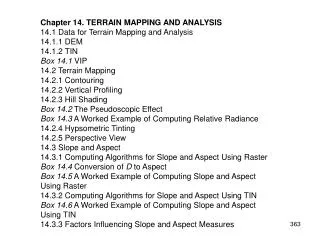
Data for Terrain Mapping and Analysis • Digital Elevation Model (DEM) • Array of elevation points • 7.5 minute USGS quads into 4 levels • Level 1 RMS 7-15 meters • Level 2 RMS of ½ contour interval • Level 3 RMS of 1/3 contour interval not to exceed 7 meters • What happened to Level 4? • Relative and absolute errors
Data for Terrain Mapping and Analysis • Triangulated Irregular Network (TIN) • Series of non-overlapping triangles • Elevation values are stored at nodes • Irregular distribution • Sources: DEMs, surveyed elevation points, contour lines, and breaklines • Breaklines are line features that represent changes of the land surface such as streams, shorelines, ridges, and roads
Data for Terrain Mapping and Analysis • Triangulated Irregular Network (TIN) • Not every point in DEM is used • Only points most important • VIP (Very Important Points) algorithm • Maximum z-tolerance algorithm • Delaunay triangulation: all nodes are connected to their nearest neighbor to form triangles which are as equi-angular as possible. • Borders are a problem • Go beyond study area and clip to make best
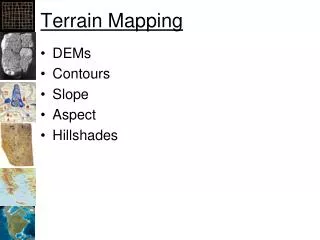
Terrain Mapping • Contouring is most common method for terrain mapping • Contour lines connect points of equal elevation (isolines) • Contour intervals represent the vertical distance between contour lines. • Arrangement of contour lines reflect topography
Terrain Mapping • Vertical profile shows changes in elevation along a line, such as a hiking trainl, road or stream.
Terrain Mapping • Hill shading is also known as a shaded relief or simply shading • Attempts to simulate how the terrain looks with the interaction between sunlight and surface features. • Helps viewers recognize the shape of land-form features on a map. • Digital shaded-relief map of US
Terrain Mapping • Four factors control the visual effect of hill-shading • Sun’s azimuth is direction of incoming light (0 to 360°) • The sun’s altitude from horizon (0-90°) • Surface slope (0-90°) • Surface aspect (0 to 360°)
Terrain Mapping • Hypsometric tinting • Applies different color symbols to represent elevation zones.
Terrain Mapping • Perspective View • Perspectives are 3-D views of the terrain wherein the appearance is as viewed from an airplane. • Viewing azimuth (0 to 360°) • Viewing angle (0-90°) • Viewing distance • Z-scale is ratio between he vertical scale and the horizontal scale (exaggeration factor) • 3-D draping of vector information
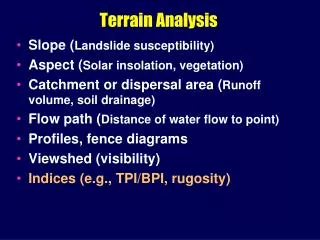
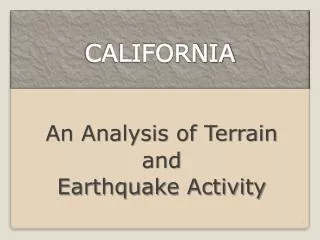
Terrain Analysis • Slope measures the rate of change of elevation at a surface location • Aspect is the directional measure of the slope (degrees- 4 or 8 directions) • Important for analyzing an visualizing landform characteristics • Accuracy an issue • If you want to try, use the worked examples in the text with Excel
Terrain Analysis • Surface curvature: convex or concave • Viewshed analysis • Viewshed refers to the areas of the land surface that are visible from an observation point or points. • Watershed analysis • Watershed is an area that drains water and other substances to a common outlet
Terrain Analysis • Watershed analysis • Requires three data sets in raster format • Filled elevation grid • Flow direction grid • Flow accumulation grid
Grid vs TIN • Different algorithms and type of output • Can be converted from TIN to grid or grid to TIN • TIN has flexibility of input sources: DEM, breaklines, contour lines, GPS data and survey data as well as user added elevation points. • Elevation grid is fixed with a given cell size
Grid vs TIN • Computational efficiency with grid • TIN gives sharper image • How are they built and used?