Download
1 / 36
360 likes | 388 Views
Learn the value, limitations, and electrophysiology of cardiac cells, recognizing abnormal ECG recordings. Understand basic ECG waves, axis evaluation, and steps to follow in interpreting ECG results. Identify normal sinus rhythm and common abnormalities like sinus tachycardia and heart blocks.

E N D
Objectives • Describe the value and limitations of the electrocardiogram (ECG). • Describe the electrophysiology of cardiac cells. • Describe how the cardiac impulse is conducted through the different structures of the heart. • Recognize various abnormal ECG recordings.
The Electrocardiogram An ECG is a popular tool because it is inexpensive, noninvasive, and easy to obtain. Often used to assess the patient suspected of having an acute myocardial infarction. Also used as a health screening tool in patients over age 40 years. It cannot predict future heart attacks or detect structural defects (e.g., valve stenosis).
Electrophysiology Normally, cardiac cells are polarized with a positive charge on the outside. When stimulated, cardiac cells depolarize as sodium rushes inside the cells. Depolarization causes the muscle cells to contract momentarily. Repolarization reestablishes the electrical imbalance across the cell membrane.
Electrophysiology (cont.) Three different types of cardiac cells are present in the heart Pacemaker cells (e.g., sinoatrial node) Specialized rapidly conducting tissue (e.g., Purkinje fibers) Atrial and ventricular muscle cells All these cells have the ability to spontaneously depolarize (automaticity).
The Impulse-Conducting System This system is responsible for initiating the heartbeat and controlling the heart rate. Normally, the SA node has the greatest degree of automaticity and paces the heart. The AV node serves as the back-up pacemaker when the SA node fails. After leaving the AV node, the impulse travels through the bundle of HIS, bundle branches, and Purkinje fibers.
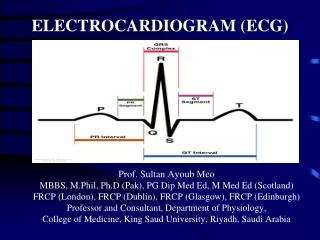
Basic ECG Waves Atrial depolarization is seen as the P wave. Ventricular depolarization is seen as the QRS complex. The normal QRS complex is not wider than 3 mm (0.12 second). The wave of ventricular repolarization is seen as the T wave.
Basic ECG Waves (cont.) The PR interval is the time from the start of atrial contraction to the start of ventricular contraction (normally not >0.20 second). Long PR intervals = heart block ST segment = the time from the end of ventricular depolarization to the start of ventricular repolarization (normally isoelectric) Elevated or depressed ST segments = ischemia
Axis Evaluation Normally, the mean axis is between 0 and +90 degrees. Right-axis deviation (+90 to +180 degrees) is consistent with right ventricular hypertrophy. Left-axis deviation (0 to 90 degrees) is consistent with left ventricular hypertrophy.
Steps to Follow Identify the atrial and ventricular rates; normally they are the same and 60 to 100/min. Measure the PR interval; normally this is <0.20 second. Evaluate the QRS complex; it should be no longer than 0.12 second. Evaluate the T wave; normally it should be upright and rounded; inversion = ischemia
Steps to Follow (cont.) 5. Evaluate the ST segment; normally it is flat; elevation or depression = ischemia 6. Assess the RR interval to evaluate the regularity of the rhythm. 7. Identify the mean QRS axis by finding the limb lead with the most voltage; if this lead has a positive QRS complex the axis is very close to where this lead is labeled on the hexaxial reference circle.
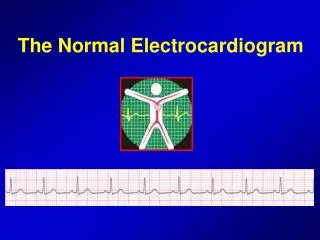
Normal Sinus Rhythm Has an upright P wave that is identical throughout the strip The PR interval is <0.20 second. The QRS complexes are identical and no longer than 0.12 second. The ST segment is flat. The RR interval is regular, and the heart rate is 60 to 100/min.
Sinus Tachycardia Recognized when the heart rate exceed 100/min at rest Each QRS complex is preceded by a P wave. A common finding in patients with acute illness and may be caused by pain, anxiety, fever, hypovolemia, and hypoxemia. It may also be caused by certain medications such as bronchodilators.
Sinus Bradycardia Heart rate is less than 60/min. Each QRS is preceded by a P wave. PR interval and QRS complex are normal. Of concern only when it causes clinical problems such hypotension and syncope Atropine is an effective treatment.
First-Degree Heart Block The PR interval exceeds 0.20 second. Each QRS complex is preceded by a P wave. Cardiac impulse is delayed in passing through the AV node or bundle of His. Typically, the RR intervals are regular. May occur after an MI or with the use of beta-blockers Treatment may not be needed.
Second-Degree Heart Block Comes in two types • Type I (Wenckebach or Mobitz type I) block; recognized when PR interval gets progressively longer until one does not pass on to the ventricles. • Type II (Mobitz type II) is less common but occurs with more serious problems such as an MI.
Second-Degree Heart Block (cont.) • Treatment of type I not usually needed. • Treatment of type II often needed and includes medications such as atropine and possibly a pacemaker.
Third-Degree Heart Block Occurs when the conduction system between the atria and ventricles is completely blocked The atria and ventricles are paced independently and there is no relationship between the P waves and the QRS complexes. The PP intervals and RR intervals are regular. Treatment includes medications to speed up the heart and a placement of a pacemaker.
Atrial Flutter Represents rapid depolarization of the atria from an ectopic focus (250 to 350/min) Causes a characteristic sawtooth pattern; numerous P waves are present for each QRS Caused by a wide variety of disorders such as rheumatic heart disease, coronary heart disease, renal failure, stress, and hypoxemia Treated with medications and cardioversion
Atrial Fibrillation Results when the atrial muscle quivers in an erratic pattern; no true P waves are seen The ventricular rate may be slow and irregular. Atrial fibrillation causes cardiac output to drop and may lead to thrombi in the atria due to blood stagnation. Cardioversion is used as treatment in most cases.
Premature Ventricular Contractions Occurs when ectopic beats originate in the ventricles PVCs are commonly the result of hypoxia, electrolyte imbalances, and acid-base disorders. QRS complex is wide and has no preceding P wave. Frequent PVCs call for treatment of the underlying cause (lidocaine offers temporary solution in some cases).
Ventricular Tachycardia Represent a run of three or more PVCs Easy to recognize as a series of wide QRS complexes with no preceding P wave Ventricular rate is usually 100 to 250/min. VT represents a serious arrhythmia that often progresses to V fib if untreated. Treatment includes cardioversion and medications.
Ventricular Fibrillation Represents the most life-threatening arrhythmia Defined as erratic quivering of the ventricular muscle mass Causes cardiac output to drop to zero The ECG show grossly irregular fluctuations with a zigzag pattern. Treatment includes cardioversion, CPR, oxygen, and antiarrhythmic medications.