The Electrocardiogram
5. The Electrocardiogram. The Electrocardiogram. Objectives Define the term electrocardiogram Describe the basics of EKG monitoring List the types of EKG leads Discuss the relevance of Einthoven’s triangle

The Electrocardiogram
E N D
Presentation Transcript
5 The Electrocardiogram
The Electrocardiogram • Objectives • Define the term electrocardiogram • Describe the basics of EKG monitoring • List the types of EKG leads • Discuss the relevance of Einthoven’s triangle • Identify and explain the grids and markings on a representative strip of EKG graph paper
The Electrocardiogram • Objectives (continued) • Describe the relationship of the following EKG waveforms to the electrical events in the heart • P wave • PR interval • QRS complex • ST segment • T wave
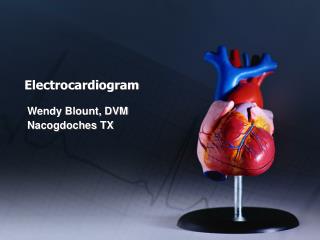
The Electrocardiogram • Electrocardiogram • Graphic representation of the electrical activity of the heart • Electrocardiograph • Machine used to record the electrocardiogram, or EKG machine • EKG • Graphic tracing of electricalactivity of the heart, not mechanical activity
The Electrical Basis of the EKG • Electrical activity is sensed byelectrodes placed on the skin surface • Recorded in the form of anelectrocardiogram • Cardiac monitor depicts electrical impulses on monitor screen oroscilloscope
The Electrical Basis of the EKG • Electrical impulses present on the skin surface are very low voltage; impulsesare amplified by an EKG machine • The printed record of the electrical activity of the heart is called arhythm stripor anEKG strip
EKG Leads • Electrode • An adhesive pad that contains conductive gel and attaches to patient’s skin • Leads • How electrodes are connected to the cardiac monitor • 3 leads must have a positive, a negative, and a ground
EKG Leads • Einthoven’s triangle • Imaginary inverted triangle formed around heart by proper placement of bipolar leads • Top formed by lead I, right side formed by lead III, and left side formed by lead II • Each lead represents adifferentlook at,or view, of the heart
EKG Graph Paper • Leaves the machine at constant speed of 25 mm/s • Time • Measured on horizontal line • Amplitudeorvoltage • Measured on vertical line on graph paper
EKG Graph Paper • Electrocardiographic • Paper divided into small squares • 1 mm in width • Time interval of 0.04 seconds
EKG Graph Paper • Electrocardiographic paper • Darker lines divide paper every fifth square • Vertically and horizontally • Large squares measure 5 mm in height and width • Represents time interval of 0.20 seconds • Five small squares in each large square
EKG Waveforms • Wave or waveform refers to movementaway from thebaselineorisoelectricline (beginning and ending of all waves) • Positive deflection • Above isoelectric line • Negative deflection • Below isoelectric line
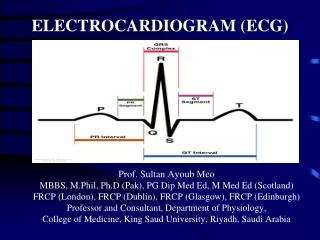
EKG Waveforms • Electrical impulse leaves SA node, produces waveform on graph paper • One complete cardiac cycle =P, Q, R, S,(QRS complex) and T wave
P Wave • First wave produced by electrical impulsefromSA node • Smooth, rounded upward deflection • Depolarization of left and right atria • 0.10 secondsin length
PR Interval • Time impulse travels from SA node through internodal pathways in atria toward ventricles • Time interval from start of P wave to start of QRS • 0.12-0.20 seconds in length
QRS Complex • Consists ofQ, R, and Swaves • Represents conduction of impulse frombundle of Histhrough ventricular muscle • Ventricular depolarization
QRS Complex • Q wave • First downward deflection • R wave • First upward deflection • Largest deflection seen in lead I and II • S wave • Downward deflection after R wave • Measures less than0.12 seconds(3 small boxes)
ST Segment • Time interval during which ventricles depolarized and repolarization of ventricles begin • Isoelectric or consistent with baseline
T Wave • Follows ST segment • Representsventricular repolarization • Slightly rounded, positive deflection • Resting phaseof cardiac cycle
Summary of EKG Waveforms • P wave • Atrial depolarization • QRS complex • Ventricular depolarization, atrial repolarization • T wave • Ventricular repolarization