Download
1 / 18
180 likes | 250 Views
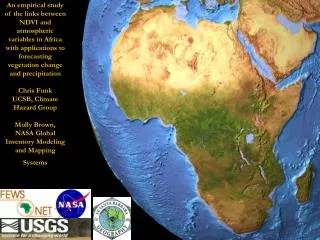
This study explores links between NDVI and atmospheric variables in Africa for forecasting vegetation change and precipitation. NDVI is connected to various factors like locusts, Malaria, and Rift Valley Fever. Examining lagged precipitation can help project future NDVI conditions. The research aims to enhance FEWS.NET executive summaries and decision support by predicting NDVI conditions in advance.

E N D
An empirical study of the links between NDVI and atmospheric variables in Africa with applications to forecasting vegetation change and precipitationChris FunkUCSB, Climate Hazard GroupMolly Brown,NASA Global Inventory Modeling and Mapping Systems E D C 1/13/2003 IRI Presentation F E W S
Background – Useful NDVI projections • NDVI is a satellite measurement of vegetation used to monitor drought • NDVI linked to locusts (Tucker, 1985; Hielkema et al., 1986), Malaria (Hay et al., 1998), and Rift Valley Fever (Linthicum et al., 1999) • RVF in 1998/1999 cost the Greater Horn ~$100 million • NDVI is linked lagged precipitation • (e.g. Nicholson, 1990; Potter and Brooks, 1998; Richard and Poccard, 1998, and others) • It seems logical to try to use lagged rainfall to project future NDVI • These projections are distinct from and compatible with NDVI forecasts based on downscaled climate information • e.g. the work of Matayo Indeje at the IRI • Future work should look at combining approaches • Best Skill = Persistence + lagged Rain + Climate Forecast
Monthly Data • NDVIe data from NASA GIMMS (1 global and 0.1 degree African) • GPCP rainfall rescaled to 1 degree • Tim Love’s CPC FEWS NET African Rainfall Climatology data (0.1 degree, Africa) • Cold cloud duration precipitation estimates blended with automatic gauge data (Love et al., 2004) • NCAR Reanalysis relative humidity fields • Class ‘C’ variable (Kalnay et al., 1996)
Talk Overview • Empirical Models of NDVI Change • Describe model • Test model • Works in most semi-arid regions • But, only some regions have decent cross-validated skill when the seasonal cycle is removed • However, most of Africa is explained well by either the seasonal cycle or the projection model • From a decision support perspective we can tell people what the NDVI conditions will be a few months in advance • Empirical analysis of lagged NDVI/precipitation relationships • NDVI can maybe help predict precipitation in a few regions • Brazil and Eastern Australia (perhaps).
Month ahead Max-to-Min NDVI Change Formulation More veg higher evapotranspiration Higher RH less evapotranspiration We assume geographicallyvarying Nmin and Nmax are fixed. These have been shown to be strongly related to average precipitation, temperature and latitude (Potter and Brooks, 1998) Less veg higher rainfall efficiency More rain more veg
Month ahead Max-to-Min NDVI Change Formulation ‘Growth’ term ‘Loss’ term We model NDVI change Loss stops whenwe reach historic minNDVI Growth stops whenwe reach historic maxNDVI Growth assumed to log-linear with precipitation Loss assumed linearlyrelated to 100-RH
Observed and Estimated NDVI Change for Zimbabwe Test Site Extremes under-estimated – could consider extending max/minbeyond historic values
Observed and Estimated NDVI for Zimbabwe Test Site ¤ Extremes under-estimated – could consider extending max/min beyond historic values ¤ Some inter-annual variability is captured
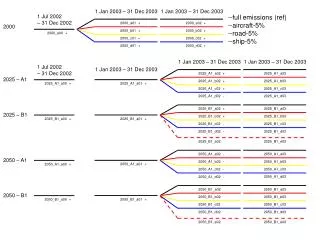
Past Observed Data 5-month max-to-min NDVI change models Future Climatological Averages G1 G2 G3 G4 G5L1 L2 L3 L4 L5 FoL1 G1 G2 G3 G4 G5L1 L2 L3 L4 L5 FoL2 G1 G2 G3 G4 G5L1 L2 L3 L4 L5 FoL3 G1 G2 G3 G4 G5L1 L2 L3 L4 L5 FoL4 ¤ Climatological averages could be replaced with forecast precipitation and relative humidity ¤ This effort meant to complement forecasting efforts by the IRI, CPC and others
Cross-validation results for Africa ¤ R2 images contain the seasonal cycle ¤ Skill = 1.0 – Var(Nobs- Nest)/Var(Nobs), Michaelsen, 1987 ¤ Some drought-prone semi-arid locations show good skill
Focus on 4 month forecast Livestock dependentRVF-prone ¤ In southern Africa low rainfall regions predicted okay, but seasonal cycle appears dominant ¤ In eastern Greater Horn region, good skills found – applications to pasture, malaria and RVF feasible
Sample Application – NE Kenya NDVI projections • In 1997/98 an extensive outbreak of Rift Valley Fever occurred in northeastern Kenya • Apx. 27,500 cases occurred in Garissa district, making this the largest recorded outbreak in East Africa, (Woods, Karpati and others, 2002) • Early warning can allow prevention, monitoring and mitigation activities
Sample Application – NE Kenya NDVI projections Test Site Caveats: Large area increases accuracy of estimatesARC rainfall known to be accurate in KenyaStill … this analysis bodes well for RVF detection
Conlcusions • We can model NDVI change in semi-arid regions with a simple max-to-min growth/loss formulation • Skill levels are high in semi-arid, low in tropical forests and places with a strong seasonal cycle • Future work will look at incorporating forecast information • We hope to create integrated monitoring/projection information products