Download
1 / 25
250 likes | 445 Views
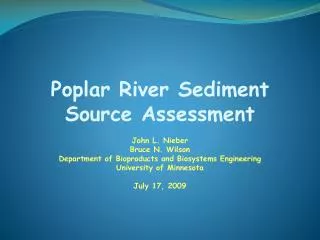
Poplar River Sediment Source Assessment. John L. Nieber Bruce N. Wilson Department of Bioproducts and Biosystems Engineering University of Minnesota July 17, 2009. Timeline. Impaired for turbidity on Minnesota’s list of impaired waters (2004)

E N D
Poplar River Sediment Source Assessment John L. Nieber Bruce N. Wilson Department of Bioproducts and Biosystems Engineering University of Minnesota July 17, 2009
Timeline • Impaired for turbidity on Minnesota’s list of impaired waters (2004) • MPCA must complete a study to determine the total maximum daily load (TMDL) • TMDL study was started in 2006, but was not finished at the planned date (2008) • The MPCA requested that the U of M team continue the work and to estimate contributions of erosion sources • Targeted completion of the Draft TMDL is 2011
Background • High turbidity threatening trout stream and health of Lake Superior • Turbidity is caused by suspended silt/clay • Poplar River is considered a nonpoint source (both natural and anthropogenic sources of pollution) • Significant streambank and bluff erosion observed; suspected as primary sources • Some measures have been taken to reduce the sediment load in the river (Mega Slump), and revegetation of bare surfaces
Specific Water Quality Problems • When comparing upstream to river mouth loading rates: • Phosphorus increased by 2X • Total suspended solids (TSS) by 6X • Mercury levels exceeded the state standard • Mercury and TSS levels were strongly correlated • Reducing sediment loss rates in the lower Poplar River will be beneficial for reduction of total mercury quantities into Lake Superior. • “…juvenile [trout] population has declined in the Poplar since 1989.” Water quality sampling was conducted according to approved MPCA quality assurance procedures (MPCA, 2000)
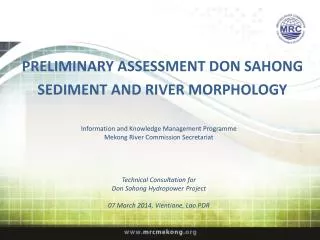
Comparison of Turbidity at different sites in the Poplar River
Comparison of Turbidity at different sites in the Poplar River Upstream (left) and downstream sites on the Poplar River, July 30, 2001 after a large rainfall (locations are approximately 3 mi apart) Photo credits: MPCA 2002
114 square miles of drainage area • Lots of upland lakes and wetlands • Soils: red lake clay and Superior lobe till • 25.5 miles of river • Has the highest percentage of urban land use of the monitored north shore trout streams (3.5%, mostly in the lower river area) • Stream bed is composed mostly of boulders and cobbles
Objectives (overall) • Acquire archived data and assess data gaps; acquire additional geomorphic data of the river and watershed, and other watershed data • Apply sediment generation and sediment transport models to assess potential sediment sources and their impact on loading and transport within the river • Evaluate and assess the sources of sediment entering and being transported within the Poplar River to Lake Superior
Current Activity (now until 10/30/09) • Acquiring and processing archived channel morphology data for critical sections of the lower Poplar River • Collected by the Cook County SWCD, MPCA, and MNDNR • Data gaps will be assessed and then filled in within scope of the project • Identify a reference watershed and stream to compare sediment generation • Modeling work plans for future studies will be formulated
WEPP model (LER, 2005 as listed in 9/2007 report by RTI) • An evaluation of soil type, land use type, and slope was conducted using a geographic information system. • The areas of distinct combinations of soil type, land use type, and slope were calculated for the Poplar River gorge area. • The land use type, soil type, and slope combination were simulated using WEPP. • Ski trails (tall and short grass); bare soils, forest, natural openings, and golf courses were simulated using the WEPP: Hillslope model. • Roads (Lutsen and non-Lutsen) were simulated using WEPP: Roads.
WEPP model (LER, 2005 as listed in 9/2007 report by RTI) This average of 180 tons/year was compared by RTI (9/2007) to the sediment transported in 2002 which was 1,112 tons/year
WEPP model (LER, 2005 as listed in 9/2007 report by RTI, 9/2007)
WEPP model application by RTI (February 2008) • Estimate erosion from major land uses in lower Poplar River watershed • Used refined resolution of landscape features • Compared results to measured sediment loads • Quantified temporal distribution of loads • Conducted sensitivity analysis
WEPP model application by RTI (February 2008) Limitations of WEPP 2006.5 (watershed version) • Poor simulation of impervious areas • Overestimate of erosion and sediment yield may occur at larger watershed sizes • Does not include bank erosion or sloughing • Does not include roads in the watershed version • Does not include erosion from perennial streams • Does not simulate gully erosion
WEPP model application by RTI (February 2008) Results • Average upland source of sediment estimated to be 76% of total load – compared to 20% in LER study • Trends between predicted and observed sediment load similar • Prediction shows that development has significant effect on sediment load
Expected data needs to fill gaps • Stream morphology • X-sections • Texture of bank materials • Bank Erosion Hazard Index (BEHI) of banks • Shear strength of bank materials • Landscape topography – LIDAR, field surveying • Identification of gullies and other concentrated sediment sources • Locations of road and trails • Soil characterization for runoff generation
Future Activity • Watershed modeling will be done to: • Better delineate the upland runoff erosion sources • Determine contribution of different sources to sediment load • Field data will be used in three models to provide estimates of erosion generated from the streambanks and bluffs – CONCEPTS, BSTEM, BEHI • Development of a method to monitor BMP effectiveness • Test this method on the Mega Slump • U of M will assist the Cook County SWCD with incorporating the results of these tasks into the TMDL report
Configuring natural flow pathways Topographic contours Flow paths in Wisconsin watershed – derived digitally
Configuring natural flow pathways Flow paths in Oklahoma watershed – derived digitally
Identifying location for erosion/sediment transport potential Unit stream power Distribution of unit stream power (watershed in SE Minnesota); from Moore and Nieber (1989)
Data needs for upland erosion distribution • Detailed topographic data • Bedrock depth – soil thickness • Soil hydraulic properties • Erodibility of soils • Field verification of connectivity of sources to ephemeral, intermittent or perennial stream channels
References • http://www.lakesuperiorstreams.org • http://www.pca.state.mn.us • http://www.epa.gov • Poplar River, MN (Cook County), 2006 Automated, in situ, Water Quality Data: Preliminary Analysis