Download
1 / 23
250 likes | 454 Views
A flash high-precision Time-to-Digital Converter implemented in FPGA technology. Topical Workshop on Electronics for Particle Physics Paris, 25 September 2009. Paolo Branchini, Salvatore Loffredo. Summary. Definition and application of a TDC; TDC’s characteristic parameters;

E N D
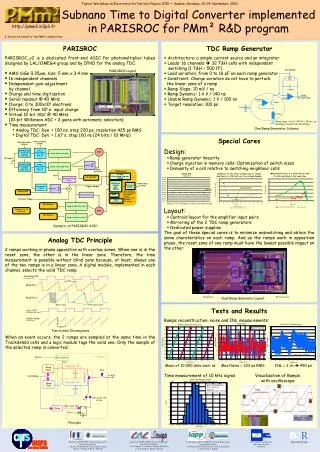
A flash high-precision Time-to-Digital Converter implemented in FPGA technology Topical Workshop on Electronics for Particle Physics Paris, 25 September 2009 Paolo Branchini, Salvatore Loffredo
Summary • Definition and application of a TDC; • TDC’s characteristic parameters; • FPGA (Field Programmable Gate Array) devices; • TDC architectures: fine and coarse structures; • TDC Tester Board; • Conclusions.
Temporal discriminator TDC START Detector Display Physical event T 267.83 ns STOP Temporal discriminator Detector Time interval measurements Applications of a TDC in Physics • The flight time of particles; • The life time of particles; • The decay time of scintillators; • Laser range finding; • Time of flight mass spectrometry; • Time of flight Positron Emission Tomography (TOF - PET).
Characteristic parameters of a TDC • Dynamic range: the larger delay that can be measured; • Resolution: the least value of the measured quantity; • Readout speed: how fast the instrument can produce a result; • Differential nonlinearity: deviation of the output bin size from its ideal value of one least significant bit (LSB); • Integral nonlinearity: deviation of the input/output characteristic and a straight line of ideal gain (slope) that best fits the curve.
Virtex 5 Cout Cout CLB Slice(1) Slice(0) Cin Cin FPGA structure
START na nb CLK0 CLK0 Fine TDC Fine TDC 6 CLK90 6 CLK90 CLK180 CLK180 CLK270 CLK270 Sel1[1:0] Sel0[1:0] STOP Coarse TDC S u b t r a c t o r TDC Start Register 32 32 Counter START Nc [33:2] CLK0 32 Stop Register 32 32 STOP CLK0 CLK0 DCM State Machine Nc Clock 550MHz Nc [1:0] CLK90 CLK180 34 2 CLK270 Sel0[1:0] Sel1[1:0] TDC architectures: fine and coarse structures The counter is used in free-running mode. When the START signal transition occurs, the current state of the counter is sampled by the START register, and the same operation occurs also when the STOP signal is delivered to the TDC. The difference between the STOP and the START register is the coarse measurement of the time interval.
The state machine clk0 clk90 clk180 clk270 The state machine samples the START and the STOP signal and detects the phase difference between the START and STOP rising edges. The least significant bit corresponds to a quarter of the clock period Furthermore the state machine is usefull to the delay line selection of the fine TDC performed in the carry chain delay line architecture. The state counter changes the output every quarter of the clock period.
D c Propagation time of the line Max measurable time Resolution Fine structure(1) The fine TDC, for the measurement of the short time intervals has been performend using a flash architecture: D c B D c B D c B D c B Start Buffer to buffer delay D c B Stop Start Small time interval Large time interval Stop Carry chain delay line This structure makes use of buffers connected between them by fast lines. The START signal after each delay unit is sampled by pertaining flip-flop on the rising edge of the STOP signal. This structure have a very short dead time equal to one clock period.
D D D D c c c c Fine structure(2) D D D D c c c c B B B B D D D D c c c c B B B B D D D D c c c B B B c B D D D D c c c B B B c B D D D D c c c B B B c B D D D D c c c B B B c B clk180 clk90 clk270 clk0 Start Choosing the right tapped delay lines The selection of the tapped delay line reflects the phase difference between the Start signal and clk0. clk0 clk90 clk180 clk270 clock Start
TDC Tester board (1) We designed and built a PCB hosting a Virtex 5 FPGA to test the TDC architecture. On the TDC Tester board, two high stability oscillators have been installed in order to compare their performance. • The first oscillator generates an output frequency of 550 MHz. • The second one provides an output frequency of 250 MHz . • Test points for high bandwidth active probes are used to perform the Virtex 5 clock signal characterization. They are placed just near the FPGA, making the shortest distance for the device output signals. • SMA connectors are used to send the START and STOP signals to the board. They may adopt differential lines or single ended signaling schemes.
TDC Tester board (2) The TDC Tester board is hosted by a VME module which allows us to test and read-out the TDC via a CPU Motorola MVME6100.
Test set-up To perform our tests we have used an architecture based on an off-shelf CPU board, the Motorola MVME6100. The VME board hosting the TDC Tester daughter card can handle A32/D16 VME cycles and is configured as slave. We have used a DTG5334 as pulse generator in order to deliver to the TDC time intervals up to 20 us with steps better than 1 ps. Since we have operated the DTGM in free running mode an accept signal was delivered by the MVME6100 to the VME slave board in order to start and stop measurements.
Clock system clk0 clk90 clk180 clk270 Real phase shifting (no to scale) Clock system clk0 clk90 clk180 clk270 Ideal phase shifting Phase detecting We executed tests of the phase occupancy of the rising edge of the start and stop signal within the system clock period. The figure below shows a plot of the hit counts as function of the phase value of the clock period for a 100 ns time interval measurements. 80000 measurements were made. clk0 clk90 clk180 clk270 Rising edge of the Start signal Rising edge of the Start signal Rising edge of the Start signal Rising edge of the Start signal The START/STOP signals skew towards the clock system of the state machine can be simplified as a clock signals deviation from the ideal behavior.
Phase correlation 0 1 2 3 4 The correlation between the rising edge of the start and stop signal for a 100 ns time interval measurements is reported below. System Clock Stop delay line START STOP STOP counts clk0 clk90 clk180 clk270 counts channel number channel number Start phase measure Start delay line The plots above are showing the hit counts as function of the channel number for the START/STOP carry chain delay lines Phase correlation Stop phase measure
RMS of the measurements We measured time interval up to 20 us and the rms of the measurements is between 35 ps and 55 ps Counts Time in micro second Time in nanosecond RMS of the time interval measurements Multi hit measurements
Non linearity of the measurements The TDC is linear up to 20 us and we measured the integral and differential non linearity within the clock period on a 2 ns time interval from 100 ns to 102 ns as function of the TDC output code. Digital output bini LSBi analog input (ns) analog input (us) 100 ns 102 ns 20 us
Conclusions • We have measured a time resolution of about 50 ps on every single measurement. • The TDC flash architecture is virtually dead time free. • FPGA electronics technology offers high design flexibility of the TDC
Nutt’s interpolation ∆t1: time interval between the rising edges of the START signal and the next reference clock; ∆t12: time interval between the two rising edges of the reference clock immediately following the rising edges of the START and the STOP signals; ∆t2: time interval between the rising edges of the STOP signal and the next reference clock. T= (∆t1+ ∆t12- ∆t2)
Implementation of the TDC in the Xilinx XC5VLX50 FPGA To perform our tests we have used an architecture based on an
system clock clk0 clk90 clk180 clk270 Real phase shifting (no to scale) Phase detecting(2) The measure of the phase occupancy of the rising edge of an asyncronous signal will depends from the skew of the signal propagating through the syncronizing stages. q0 syncronizer stage (Virtex 5 Slice) D Q clk delay D Q clk D Q clk clk0 D Q clk HIT clk0 clk90 q90 syncronizer stage (Virtex 5 Slice) D Q clk delay asyncronous signal D Q clk D Q clk clk90 D Q clk clk180 HIT clk270 The asyncronous signals skew can be simplified as a clock signals deviation from the ideal behavior. Rising edge of the asyncronous signal q180 syncronizer stage (Virtex 5 Slice) Rising edge of the asyncronous signal Rising edge of the asyncronous signal Rising edge of the asyncronous signal D Q clk delay D Q clk D Q clk clk180 D Q clk HIT q270 syncronizer stage (Virtex 5 Slice) D Q clk delay counts D Q clk D Q clk clk270 D Q clk HIT phase occupancy
Delay line non linearity D Virtex 5 slice c B D c B D Virtex 5 slice c B D c B D c B counts D c B D 454 ps Virtex 5 slice c B D c B channel number D c B The slice is divided in two substructure made of couple of flip-flop. The propagation time of the first and the third buffer inside the slice are so low that: D c B the first couple of flip-flop switch always together, DELAY LINE START while the second couple of flip-flop switch often together. STOP The mean propagation time of every buffer of the line is 13 ps.
High Stability Oscillators VFTX140 VFOV200 Features: Features: • 550 MHz frequency; • LVPECL output levels; • 3.3 V supply voltage; • Operating temperature range between 0°C and 70°C ; • Frequency stability vs operating temperature is less than 0.28 ppm; • Frequency stability on overall conditions (including aging 20 years) is less than 4.6 ppm. • 250 MHz frequency; • HCMOS output levels; • 3.3 V supply voltage; • Operating temperature range between -30°C and 70°C ; • Frequency stability vs operating temperature of 10 ppb; • Frequency stability vs supply voltage of 1 ppb; • Frequency stability vs aging/day of 0.5 ppb, aging/year 0.1 ppm.