Download
1 / 8
80 likes | 95 Views
Learn how to use the Performance tool in Microsoft Windows 2000 to monitor and collect performance information for your Network Load Balancing cluster. Understand workloads, observe trends, test configuration changes, and diagnose problems for optimization.

E N D
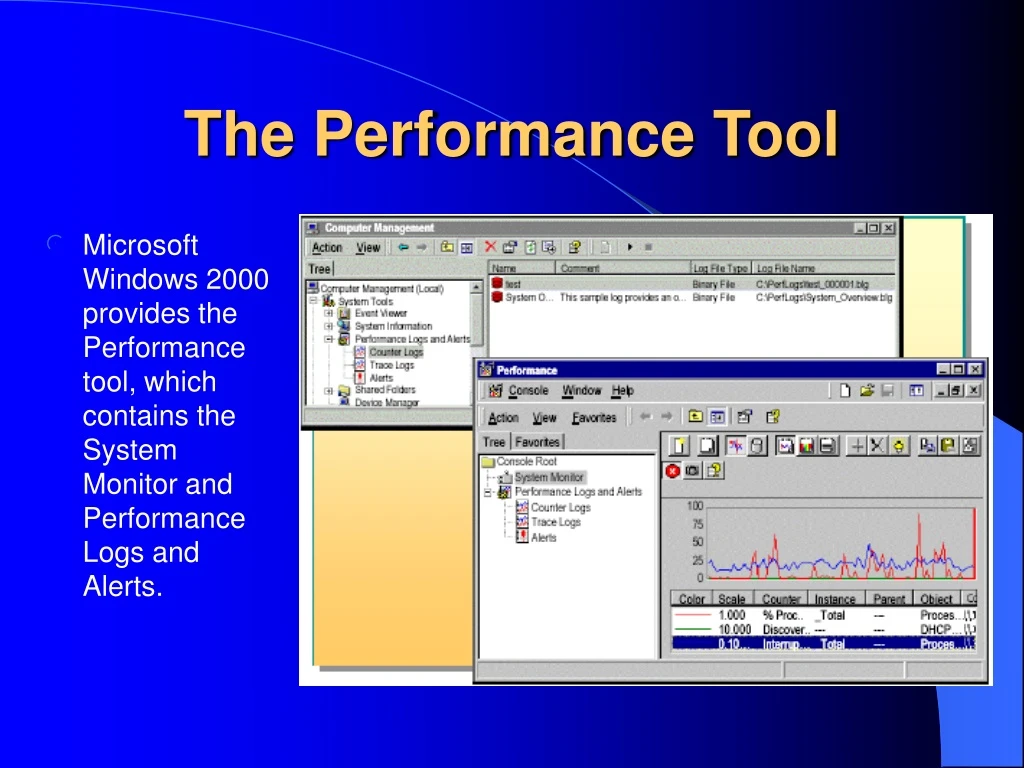
The Performance Tool • Microsoft Windows 2000 provides the Performance tool, which contains the System Monitor and Performance Logs and Alerts.
Microsoft Windows 2000 provides the Performance tool, which contains the System Monitor and Performance Logs and Alerts. You can use these tools or utilities to display and collect performance information for the Network Load Balancing cluster. Monitoring system performance is an important part of maintaining and administering your cluster. You can use performance data to: • Understand your workload and the corresponding effect on your cluster or individual cluster hosts. • Observe changes and trends in workloads and resource usage so that you can plan for future upgrades to the cluster or decide whether you should implement scale up or scale out strategies. • Test configuration changes or other tuning efforts by monitoring the results. • Diagnose problems and target components or processes for optimization.
System Monitor and Performance Logs and Alerts provide detailed data about the resources that are used by specific components of the operating system and by server programs that have been designed to collect performance data. The components of this tool are: • Graphs that provide a display for performance-monitoring data. • Logs that provide recording capabilities for the data. • Alerts that send notification to users by means of the Messenger service when a counter value reaches, rises above, or falls below a defined threshold.
Performance Objects and Counters • Performance objects and counters supply data from system components in your computer. As a component performs work on your system, it updates the performance data. The data is described as a performance object and is typically named for the component generating the data. For example, the Processor object is a collection of performance data about processors on your system. • Note: There are no specific performance objects and counters for the Network Load Balancing driver. Because the driver is installed in the Transmission Control Protocol/Internet Protocol (TCP/IP) stack you can monitor the IP data below and above the driver.
In monitoring your system, you can use many performance objects, for example, in a Network Load Balanced Web site you can monitor the Internet Information Services (IIS) and Hypertext Transfer Protocol (HTTP) performance objects to assess the performance of the Web site. Because Network Load Balancing works only with IP traffic, the objects you will use most frequently to monitor the Network Load Balancing drivers are: • IP • TCP • User Datagram Protocol (UDP) • Note: To monitor TCP/IP statistics on computers running Windows 2000, install the Simple Network Management Protocol (SNMP) service. Performance Logs and Alerts access these TCP/IP statistics.
Performance Data Collection Strategies • The System Monitor tool allows you to capture real-time monitoring and display of performance data. With the Performance Logs and Alerts tool you can acquire performance data to designated file and alerts on any counter. The tools permit access to local and remote computers. • You can generate performance monitor log files on individual servers, or you can obtain the data from multiple servers by a single instance of Performance Monitor, writing the data to a centralized log. To ensure the smallest file sizes, always record data by using the binary format.
You can collect data in the following ways: • Centralized, when the number of counters is low, or the collection interval is long, or both. • Distributed, when the number of counters is high, or the collection interval is short, or both.
When collecting performance data you must decide whether you will collect data locally or from a central location. It is recommended that the collection of data be centralized but not collected by using the Network Load Balancing cluster IP address. If you collect data by using the cluster IP address, the inbound collection impacts throughput to the cluster.