Introduction to Open Source Performance Tool --Linux Tool Perf
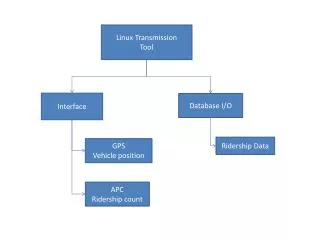
Introduction to Open Source Performance Tool --Linux Tool Perf. Yiqi Ju (Fred) Sep. 13, 2012. Task. 07/09~09/14 Verizon Box Embedded System Software Environment Open Source Performance Tools Kernel Profiling. Kernel Profiling?.

Introduction to Open Source Performance Tool --Linux Tool Perf
E N D
Presentation Transcript
Introduction to Open Source Performance Tool --Linux Tool Perf Yiqi Ju (Fred) Sep. 13, 2012
Task • 07/09~09/14 • Verizon Box • Embedded System • Software Environment • Open Source Performance Tools • Kernel Profiling
Kernel Profiling? • Collect and analyze kernel space system-wide resource statistic • HW trend—increasing core numbers • SW performance—find the bottleneck • Solution—full use of available tools
Available Tools • Top(on board)/htop --real-time monitoring • Sysstat utilities --sar, iostat (on board), vmstat… • SS—socket statistics • Lttng—kernel tracing • Perf—counting and sampling • …
Perf Tool • Perf_event kernel interface • Linux kernel subsystem, merged into v2.6.31 and after
Perf_event Kernel Interface • Performance counter—hardware counter, no bother register, often called PMU (Performance Measurement Unit) • Event-oriented API—do not use HW register but relies on PMU ready CPUs • Support Events grouping, measure simultaneously Source: Perf File Format, Urs Fassler. CERN openlab
Sampling • Perf record initializes sampling through perf_event interface • Create blank mmap pages to kernel space • Kernel writes record and send back to perf, perf record *.data file and save to current directory
Sampling cont. Blank mmap pages generated through perf_events Written mmap page Source: Perf File Format, Urs Fassler. CERN openlab
Advantage • Low overhead—compare to instrumenting profiling • Fast—counting is done at the time the load is off, even cannot tell delays • Bunch of usages, provides much information
Perf usage metro-root-perf_record> perf usage: perf [--version] [--help] COMMAND [ARGS] The most commonly used perf commands are: annotate Read perf.data (created by perf record) and display annotated code diff Read two perf.data files and display the differential profile list List all symbolic event types lock Analyze lock events probe Define new dynamic tracepoints record Run a command and record its profile into perf.data report Read perf.data (created by perf record) and display the profile sched Tool to trace/measure scheduler properties (latencies) stat Run a command and gather performance counter statistics timechart Tool to visualize total system behavior during a workload top System profiling tool. trace Read perf.data (created by perf record) and display trace output …
List of pre-defined events (to be used in -e): cpu-cycles OR cycles [Hardware event] instructions [Hardware event] cache-references [Hardware event] cache-misses [Hardware event] branch-instructions OR branches [Hardware event] branch-misses [Hardware event] bus-cycles [Hardware event] cpu-clock [Software event] task-clock [Software event] page-faults OR faults [Software event] minor-faults [Software event] major-faults [Software event] context-switches OR cs [Software event] cpu-migrations OR migrations [Software event] alignment-faults [Software event] emulation-faults [Software event] L1-dcache-loads [Hardware cache event] L1-dcache-load-misses [Hardware cache event] L1-dcache-stores [Hardware cache event] L1-dcache-store-misses [Hardware cache event] L1-dcache-prefetches [Hardware cache event] L1-dcache-prefetch-misses [Hardware cache event] L1-icache-loads [Hardware cache event] L1-icache-load-misses [Hardware cache event] L1-icache-prefetches [Hardware cache event] L1-icache-prefetch-misses [Hardware cache event] LLC-loads [Hardware cache event] LLC-load-misses [Hardware cache event] LLC-stores [Hardware cache event] LLC-store-misses [Hardware cache event] LLC-prefetches [Hardware cache event] LLC-prefetch-misses [Hardware cache event] dTLB-loads [Hardware cache event] dTLB-load-misses [Hardware cache event] dTLB-stores [Hardware cache event] dTLB-store-misses [Hardware cache event] dTLB-prefetches [Hardware cache event] dTLB-prefetch-misses [Hardware cache event] iTLB-loads [Hardware cache event] iTLB-load-misses [Hardware cache event] branch-loads [Hardware cache event] branch-load-misses [Hardware cache event] … List of Events
Perf stat metro-root-perf_record> perf stat -e L1-dcache-loads -e L1-dcache-load-misses -e dTLB-loads -e dTLB-load-misses -e L1-icache-loads -e L1-icache-misses start_appli Start_appli… Performance counter stats for 'start_appli': 354543239 L1-dcache-loads (scaled from 80.54%) <not counted> L1-dcache-load-misses 507073444 dTLB-loads (scaled from 83.87%) 305313 dTLB-load-misses (scaled from 83.89%) missrate: 0.0602% 2303127335 L1-icache-loads (scaled from 83.80%) 7994049 L1-icache-load-misses (scaled from 84.33%) missrate: 0.347% 74.850334944 seconds time elapsed ----- (Data from mt2179, P1.0 board, 12:25AM, 9/12/2012)
Perf stat cont. metro-root-perf_record> perf stat -e dTLB-loads -e dTLB-load-misses -e L1- icache-loads -e L1-icache-misses start_appli … Performance counter stats for 'start_appli': 534611783 dTLB-loads 308219 dTLB-load-misses missrate: 0.0577% 2375996954 L1-icache-loads 7810360 L1-icache-load-misses missrate: 0.329% 55.029461151 seconds time elapsed ----- (Data collected from mt2179, P1.0 board, 12:35PM, 9/12/2012)
Perf record/report metro-root-perf_record> perf record -F 3000 -o startapp.data start_appli … [ perf record: Woken up 1 times to write data ] [ perf record: Captured and wrote 0.560 MB startapp.data (~24470 samples) ] … metro-root-perf_record> perf report -i startapp.data > startapp.txt
(Data collected from mt2179, P1.0 board, 12:35PM, 9/12/2012)
Perf diff metro-root-perf_record> perf diff lsactive.data lslactive.data (Data collected from mt2179, P1.0 board, 12:35PM, 9/12/2012)
More on future • Perf timechart—visualize total system behavior in time sequence • Perf trace—enable script tracing, Perl support from 2.6.33-rc, Python support patches available • Perf annotate—source code allocation • Perf event converter, web-based GUI enable remote profiling
References • Perf_event project http://web.eecs.utk.edu/~vweaver1/projects/perf-events/index.html • Perf File Format by CERN openlab http://openlab.web.cern.ch/sites/openlab.web.cern.ch/files/technical_documents/Urs_Fassler_report.pdf • Perf wiki https://perf.wiki.kernel.org/index.php • perf_events status update by Stephane Eranian, Google, Inc. • Kenel mailing list http://lwn.net/Articles/373842/