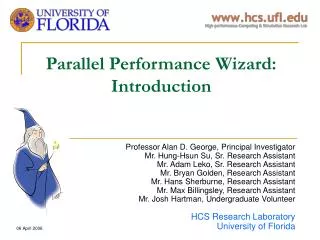
Parallel Performance Wizard: A Generalized Performance Analysis Tool
Parallel Performance Wizard: A Generalized Performance Analysis Tool Hung-Hsun Su, Max Billingsley III, Seth Koehler, John Curreri, Alan D. George. PPW Overview.

Parallel Performance Wizard: A Generalized Performance Analysis Tool
E N D
Presentation Transcript
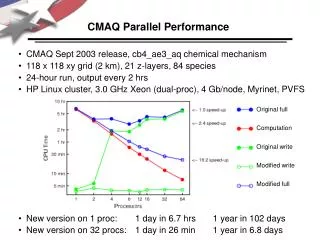
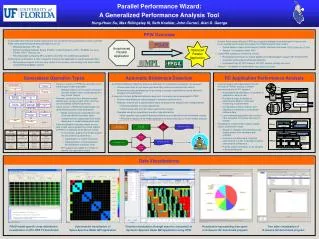
Parallel Performance Wizard: A Generalized Performance Analysis Tool Hung-Hsun Su, Max Billingsley III, Seth Koehler, John Curreri, Alan D. George PPW Overview • Computationally intensive parallel applications are constantly being developed in many scientific fields using parallel programming paradigms such as: • Message-passing: MPI, etc. • Partitioned Global Address Space (PGAS): Unified Parallel C (UPC), SHMEM, Co-array Fortran (CAF), Titanium, etc. • Reconfigurable Computing (RC) systems and other non-traditional paradigms • Performance optimization is often needed to minimize the application’s overall execution time • Performance analysis tools are very useful in this process, but existing tools have limited programming paradigm support • Parallel Performance Wizard (PPW) was originally designed and developed to improve the much-needed performance tool support for PGAS programming models • Global Address Space Performance (GASP) interface introduced (http://gasp.hcs.ufl.edu) • Version 1.0 released in April 2007 • Latest PPW updates & extensions include • Redesigned framework to enable additional model/paradigm support with minimal effort • Automatic performance bottleneck detection • Enhanced Cray XT UPC support; HP UPC support coming very soon • Version 1.1 available for download at http://ppw.hcs.ufl.edu FPGA Generalized Operation Types Automatic Bottleneck Detection RC Application Performance Analysis • Previous versions of PPW (as with other tools) were largely model-dependent • Multiple versions of the same component (one per model) had to be developed in a very similar fashion • However, constructs from different models behave very closely to each other, and thus can be handled similarly by the tool • Latest version of PPW takes advantage of a generalized operation type abstraction • Model constructs are classified into one of the pre-defined operation types • Components are categorized into model-dependent or model-independent parts • Once modification has been made, we are able to add new programming model support to PPW in a relatively small amount of time • In most cases, adding new model support can be achieve by performing • Classification of model constructs • Implementation of instrumentation and bottleneck resolution units • MPI support was added in a matter of months (as opposed to years) • Automatic bottleneck detection feature is desirable for a performance analysis tool because • Novice users often do not know upon what they should concentrate their efforts • Performance data generated by long-running or complex applications can be difficult to visualize and understand • A new post-mortem bottleneck detection approach is currently being developed for PPW • Perform data filtering at various stages to minimize execution time • Detection mechanism is parallelizable (each node performs analysis semi-independently) • Potential speedup for large applications • Performance data from all nodes need not be merged • Operates using the generalized operation type abstraction • New operation type-specific detection mechanisms to identify known bottleneck classes • Potential to support multi-model application (one that uses two or more models) analysis • Instrumentation and measurement of both CPUs and FPGAs, towards a unified performance tool for RC systems • Automated instrumentation of hardware & software for ease-of-use • Runtime storage & transfer of performance data for continued monitoring of performance • Configurable profiling, tracing, and sampling in hardware to complement software data • Low overhead (application can run at or near full-speed to improve accuracy of results) • Visualization of performance data in tables, charts, and timeline views • Allows for strategic instrumentation and measurement from hardware and software • Enables a cohesive view of system performance in order to facilitate locating performance bottlenecks • Provide useful information to aid designer in fixing bottlenecks Data Visualizations PGAS model-specific array distribution visualization of UPC NPB FT benchmark Tree table visualization of N-Queens RC benchmark program Data transfer visualization of Space Aperture Radar MPI application Timeline visualization (through export to Jumpshot) of Synthetic Aperture Radar MPI application using PPW Visualization representing time spent in N-Queens RC benchmark program