Download
1 / 23
360 likes | 1.05k Views
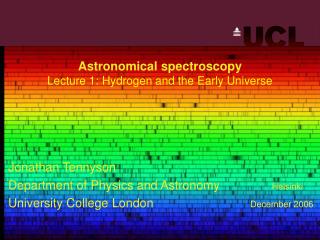
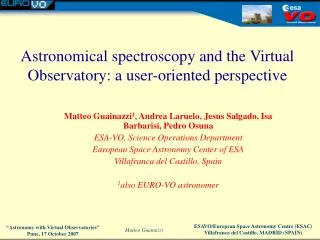
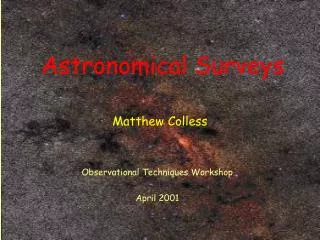
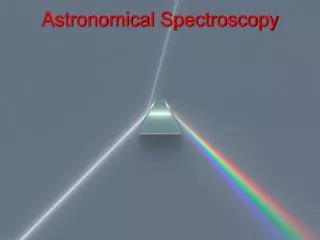
Astronomical Spectroscopy. Astronomical Spectroscopy. Astronomical spectroscopy is done by attaching a spectrometer to a telescope A spectrometer is a device separates the individual wavelengths of the incoming light and measures the intensity of each

E N D
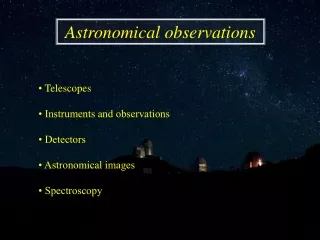
Astronomical Spectroscopy • Astronomical spectroscopy is done by attaching a spectrometer to a telescope • A spectrometer is a device separates the individual wavelengths of the incoming light and measures the intensity of each • Every spectrometer consists of two distinct components: • A disperser, which sorts the incoming light by wavelength, and then sends light of different wavelength along different directions, so that each wavelength will be observed at its own location. • The disperser is what makes a spectrometer a spectrometer. It is the components that separates light of different wavelength • There are many types of dispersers, prims, grisms, gratings, etc. • Technology differs, but they all do the same thing: sort light of different wavelength • A camera, which images the stripe of dispersed light (spectral image) and focuses it onto the detector, which in turn records the spectral image.
Example of a disperser: the prism Here the image of this beam of light is a point Here the image of this beam of light is a line
Extracting information from the dispersed image:the digital read-out and the extracted spectrum The extracted spectrum is what is used to do science Wavelength (Angstrom)
Why Spectroscopy • We take spectra of astronomical sources to: • Identify their nature • The spectrum of a Star differs from that of a Galaxy, which differs from that of a Quasar • Measure their chemical composition and the abundances of chemicals • The universe becomes richer and richer of chemical elements as time passes. • Study their motions, measure their speeds • Fundamental to understand the evolution of the sources and how their interact with each other (e.g. merging, collisions) • Measure their redshift, determine their distance from us • Fundamental to chart the large-scale structure of the Universe and to study the formation of cosmic structures (groups, clusters, superclusters)
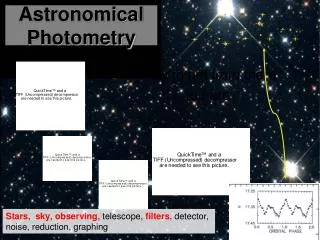
Spectra: continuum emission, line emission, and line absorption These are emission lines, some are isolated, some are in densely-packed bands of lines This is a continuum spectrum (the Solar Black Body), with absorption lines by intervening gas T = 5,800 K Shall we try to see real spectra using a simple, but absolutely real spectrometer?
Identifying the nature of sources Star-forming galaxy Star Quasar Passive galaxy
The chemistry of sources: spectral chemical patterns These are spectra obtained in the Lab. We use them as template to identify the chemicals in the observed spectra of sources Spectral lines (both emission and absorption ones) are like a cosmic barcode system for chemical elements.
Studying the chemistry of galaxies This galaxy with weaker emission lines has 3x the abundance of chemicals of our own Milky Way Galaxy. This galaxy with much stronger emission lines has 1/5x the abundance of chemicals of our own Milky Way Galaxy
Studying the chemical composition of gas The picture shows the spectrum of: Distant cold inter-galactic gas Distant galaxies Local galaxies The galaxies clearly show the presence of Magnesium (Mg)and Iron (Fe) in their spectra The Inter-galactic gas only shows Magnesium, but not iron If confirmed, this would be the first detection of cold, dense gas with primordial chemical composition ever observed. This would be the primeval gas out of which early galaxies form
Doppler shift: studying motions (e.g. of gas) Notice that these lines are observed at bluer wavelength than in the Lab: the gas is moving toward us at V≈-350 km/s Here the same line are observed at the same wavelength as in the Lab: no motions • These spectra show the absorption by interstellar gas (Magnesium) in star-forming galaxies • In the local galaxies, the gas absorption has the same wavelength as in the Lab: no motions • In the distant galaxies, the gas is observed at bluer (shorter) wavelengths: it is moving away from the galaxies (toward us) at V≈-350 km/s
Measuring Rotation We determine the rotation velocity by measuring the Doppler shift
The effect of the cosmic expansion of space: redshift Shown here is the spectrum of the same galaxy placed at higher and higher redshift. Thehigher the redshift (z), the more the spectrum is observed shifted to redder wavelengths (l), the more the galaxy appears fainter. The redshift is induced by the stretching of space by the cosmic expansion! Notice that to observe the same portion of the spectrum at higher and higher redshift, one needs to use band-pass filters of longer and longer wavelength
Expansion stretches photon wavelengths, causing a cosmological redshift directly related to lookback time
The effect of redshift A gallery of spectral images of galaxies at increasingly higher redshift (labeled on the left) These are all star-forming galaxies observed very early in the cosmic evolution (primeval galaxies) The emission line shown in the circles is observed at longer wavelengths in those galaxies located at higher redshift The line is called Lya
Continuum emission, line emission, and line absorption: let’s observe them! These are emission lines, some are isolated, some are in densely-packed bands of lines This is a continuum spectrum (the Solar Black Body), with absorption lines by intervening gas T = 5,800 K Shall we try to see real spectra using a simple, but absolutely real spectrometer?