Download
1 / 40
400 likes | 548 Views
Earthquake Hazard Assessment in the Pacific Northwest: Site Response. Thomas L. Pratt U. S. Geological Survey School of Oceanography University of Washington. Earthquakes are inevitable: How do we deal with their effects?. Design buildings to an appropriate level of safety

E N D
Earthquake Hazard Assessment in the Pacific Northwest:Site Response Thomas L. Pratt U. S. Geological Survey School of Oceanography University of Washington
Earthquakes are inevitable:How do we deal with their effects? • Design buildings to an appropriate level of safety • Prepare emergency services to respond • Inform citizens how to prepare and respond
Need to know: • How often are different types of earthquakes likely to occur? • How strong will the shaking be? • How will the shaking vary across the region? • At what frequencies will the ground shake?
Estimating the ground shaking from earthquakes • Probabilistic Hazard Maps • Peak Ground Acceleration likely in a given time interval • Example: • 2% chance of 0.25g acceleration being exceeded in a 50-year time span
Earthquake Hazard Analysis • Plate motions • GPS • EQ monitoring (PNSN) • Geophysics (SHIPS) • Geology • LIDAR • Paleoseismology Probabilistic Hazard Maps
Buildings and Resonant Frequency 1-story building (house) ~ 0.1 sec period = 10 Hz 10-story building ~1 sec period = 1 Hz [e.g., library] 35-story building ~ 3.5 sec = 0.3 Hz [e.g., Smith Tower] 75-story building ~ 5 sec = 0.13 Hz [e.g., Columbia Tower]
Ground Motion Modeling Probabilistic Hazard Maps Building Design Site Response Estimates
Spectral ratios(to eliminate source signature) • Simple Spectral Ratio – site/bedrock site • H/V ratio (horizontal/vertical recording) Horizontal site Horizontal site Horizontal bedrock Vertical site Simple Spectral Ratio – site/bedrock site H/V ratio (horizontal/vertical recording)
Fr=1/4T resonance,impedancechanges A=Ir/Is=rvr/svs
Surface Waves movie
Low freqs: large over Seattle Basin High freqs: Small over Seattle Basin
Seattle SHIPS (site response) • 90 seismometers (3-component) recording continuously from Jan 27 to May 24, 2002 • Identical instrumentation with 2 Hz sensors • Local: magnitude 2.0 to 2.1 or greater visible across array (~every 3 days?) • Teleseisms: magnitude 7.0 to 7.3 or greater visible across array (~15-20/year)
Kingdome SHIPS • Kingdome demolition • Movie
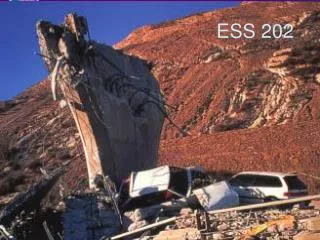
Nisqually Earthquake • Effects of surface waves • Relatively modest ground motions • Maximum PGA of 0.27g • Non-linear soil response • Amplifications much smaller for strong ground motions (mainshock versus aftershock)
Results from SHIPS/Nisqually • Seattle Basin characterized by amplifications of 8 to 12 at low frequencies (0.3 to 0.8 Hz (3.33 sec to 1.25 sec periods) • At higher frequencies (5 to 10 Hz) the basin causes decreased shaking • Amplification is time variant • (direct arrivals versus surface waves?) • Amplifications of 5 could come from resonance in the shallow deposits (<500 m) • Amplifications from focusing likely <2 • Surface waves within the basin cause amplifications of as much as 16 • Non-linear effects come into play at moderate ground accelerations