Download
1 / 41
410 likes | 423 Views
This lecture explores how to establish the reliability of a novel index, X, and highlights the importance of reliability in substantive analyses. It covers methods for assessing reliability with categorical and quantitative variables and discusses meta-theoretical issues such as the level of analysis and data format. The lecture also includes lecture outlines and details for three different data formats.

E N D
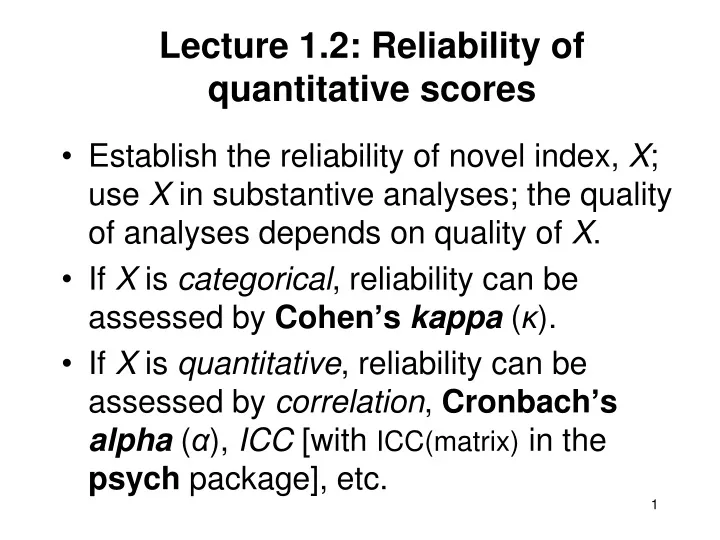
Lecture 1.2: Reliability of quantitative scores • Establish the reliability of novel index, X; use X in substantive analyses; the quality of analyses depends on quality of X. • If X is categorical, reliability can be assessed by Cohen’s kappa(κ). • If X is quantitative, reliability can be assessed by correlation, Cronbach’s alpha(α), ICC [with ICC(matrix) in the psych package], etc.
Meta-theoretical issues • At what level of analysis should we conduct a reliability analysis? • In HW-1: the ‘thought’ or the ‘participant’? • In McLoyd et al (Lec 1.1): the ‘30 sec interval’ or the ‘30 min exptl session’? • Are ratings categorical, ordinal or interval-scaled (quantitative)? How many raters? Are some ‘experts’ and some ‘novices’? What is the data format? • Data format influences definition of reliability
Lecture Outline(s) • {Data Set + Format} {Formula for computing reliability of X} • We should understand the theory justifying the formula used in computation. E.g., the χ2 approach used for Cohen’s κ; the ANOVA approach for ICC and Cronbach’s α • We consider 4 ‘formats’
Lecture Outline(s) 2. {Theory + Format} {Reliability} • How to design optimal ‘tests’ (or ‘scales’), e.g., by using ‘consistent’ items, or ‘long’ tests? “Intro to Test Theory” • To estimate ‘structural’ parameters of a substantive model separately from ‘measurement’ parameters. This leads to unbiased (therefore, better) tests of the substantive model. “Intro to SEM” • We may not get to this today
1. Data format reliability • 2-way design: 2 (or k) raters categorisep objects into discrete categories. Reliability = % agreement (see HW-1) • 1-way design: Each of p objects is given a quantitative score by k randomly chosen raters, different for each object. Reliability = ICC • 2-way design: 2 (or k) raters give a quantitative score to p objects. Reliability = correlation & related indices
1.1. Details for 3 data formats 1. 2 raters each classify the same p (‘large’) objects into 2 to 5 categories. Raw data is a p (object) x 2 (rater) matrix of categorical ratings. Reliability = % agreement, corrected for chance = Cohen’s kappa. This can be calculated form a cross-tabulation of ratings, as shown in Lec. 1.1.
2. Each of many objects is rated on a quantitative scale by krandomly chosen raters. (E.g., a large pool of doctors at Clinic.) 2.1. Different raters rate the different objects and we do not have a p by k format, because there are no ‘rater.1’, ‘rater.2’, etc. columns. Rather, we have a 1-way array with p‘groups’ and k observations per group. 2.2. Reliability is now the degree to which the ratings within a group are more similar than the ratings between groups. It is indexed by the intraclass correlation, ICC.
Each of p objects is rated by k (= 3) randomly chosen raters. This is a 1-way design.
ICC and ANOVA • To pursue the idea that ICC measures the within-group similarity relative to between-group similarity, consider the 1-way ANOVA model: i indexes the groups, and j indexes the j’th obs, Yij, within the i’th group: • In the fixed effects ANOVA model, we treat the groups as ‘fixed’, e.g., male vs female, or low vs medium vs high. In the present context, it is more reasonable to treat the groups as having been randomly selected, e.g., objects, households, twins. Hence we use the ‘random effects’ model of ANOVA.
Yij is the score of the j’th person (rater) in the i’th group (object), is the overall population mean. • ai is a random variable representing the ‘effect of being in group i’. Everyone in group i has the same value of ai, which varies randomly from group to group, with a mean of 0 and a variance of .
eij is a random variable representing the ‘measurement error’ in the score of the j’th person in group i. eij is a random variable with a mean of 0 and a variance of , and it is independent of ai. • The ‘total variance’ is the variance of Yij. This variance is the sum of the variances of ai and eij: var(Yij) = var(ai) + var(eij) = + . • The ICC is defined as the fraction of total variance accounted for by variation over groups.
There are many algebraic definitions of ICC, all conveying the notion of within-group similarity relative to between-group similarity, but differing in the assumed correlation between the group effect, ai, and the measurement error, eij. • ‘sintraclass1.r’ shows different formulae for ICC for 1- and k-item tests • The formula, ICC = (F - 1)/(F + k - 1), shows that, as F becomes very large (i.e., within-group similarity becomes very large relative to between-group similarity), ICC tends to 1. ICC = 0, when F = 1, i.e., when MSw = MSb.
‘Random effects’ models are often more realistic than ‘fixed effects’ models, and they deserve special attention - as do models with both fixed and random effects, known as ‘mixed’ models.
2-way designs: Quantitative ratings 3. Same as #1 (k raters, p objects), except that ratings are continuous, not categorical. Reliability = Correlation, r, across objects between 2 sets of ratings. (Here, % agreement will be very low, and is not a useful index!)
We array the ratings given by the k (= 3) raters to p objects, as follows.Reliability = Correlation, Cronbach’s alpha
Cronbach’s alpha in 2-way tables • Arrange data into 2-way table, e.g., ‘objects’ as rows, ‘raters’ as columns • Reliability high if the profile (rise & fall) of scores in a column is the same for all columns; i.e., if the (rank) correl between columns is high; i.e., if the row * column interaction is low. • This is the idea underlying Cronbach’s alpha (α).
A 2-way ANOVA with n = 1 obs per cell; k raters (columns) and p participants (rows). Let MSp be the MS for Participants, and MSres be the MS residual. Using the EMS formula for this ANOVA (see the next slide), we can estimate the variance due to participants, σp2, as (this is the ‘true’ variance across P’s!): ‘P’ is a random effects variable. Should ‘rater’ be regarded as a random effects variable too? It depends on the research design.
EMS for 2-way design when n = 1 If A and B are random, MSE is the appropriate denominator in the F ratio for testing both main effects, even if .
p (objects) x k (raters) matrix • In the preceding EMS Table, let A be ‘raters’, with a = k levels, let B be ‘objects’ or ‘participants’, with b = p levels, and let us consider the case, “A and B random”. Then:
Then Cronbach’s alpha (α) is defined as: • F is now defined as MSp/MSres. • SPSS gives alpha: Analyze > Scale > Reliability Analysis, etc. • If the DV is a single rater’s score, reliability =α. • If the DV is the average score for k raters, it will be shown later that reliability = (kα)/[1+(k-1)α].
The R function, kappam.light() • The package, irr, seems to be most flexible (moreso than psych), containing many indices of reliability. However, it does not accept an agreement matrix as input, only raw data. For agreement matrices, use cohen.kappa() in psych. (See HW-1 for details.) • Compare results of kappam.light(), when data are ‘counts’, with alpha. Do they agree?
4. Weighted indices of reliability • So far, we’ve defined reliability for categorical and for quantitative ratings. How to proceed when the categories used in rating are ordinal, not merely nominal; e.g., symptoms are ‘absent’, ‘mild’, or ‘severe’. • In this case, we wish to count a disagreement between, e.g., ‘absent’ and ‘mild’ as less than one between, e.g., ‘absent’ and ‘severe’. • We do so by assigning ‘weights’ for each level of disagreement.
Levels of disagreement • Let the categories be 1, 2, …, m; let i be the discrepancy between 2 ratings, k and l. That is, i = |k – l|. • Let wi be the ‘level’ of agreement, i.e., the ‘weight’ assigned to i. The maximum value of i = m – 1, and the minimum value is 0. How to choose {wi}?
Weights used in reliability indices • Unweighted case: wi = 1 if i = 0, and wi = 0 if i > 0 • Linear weights: • Quadratic weights:
Which weights to use? • If ‘cost’ of disagreement is approx proportional to i, use the linear weights. • If ‘small’ disagreements, e.g., i = 1, are much less important than ‘large’ ones, use the quadratic weights. (Equivalent to using Pearson r as reliability index!) • If ‘small’ disagreements are just as important as ‘large’ ones (as in recalling a phone #), use the unweighted index.
Pivot to theory-based approaches to reliability • For many (4, at least) data ‘formats’, we know how to compute reliability. • Theory-based approaches rely on a very general model, Test Theory, in which a ‘test’consists of many ‘items’, and we wish to express the reliability of the ‘test’ as a function of that of ‘items’ • Define reliability as internal consistency of a ‘test’.
Generality of ‘item/test’ model • This model of ‘tests’ as consisting of ‘items’ is very general: • Averaging across trials of BOLD activity to get more reliable signal of brain activity • Measuring a construct by 2 or more methods • Using k semantic differential scales to measure ‘thought valence’ or ‘attitude’ • Thus interest in ‘reliability’ is, or ought to be, widespread
Summary of Theory-based results • ‘Test’ has k (or n)‘items’ for measuring a construct on ‘persons’. Or, analogously, replace ‘test’ by ‘method’, ‘item’ by ‘rater’, and ‘person’ by ‘object’. • Qu: Is test reliable? • Reword question as: “Is test internally consistent, i.e., do the items“hang together”, i.e., is the correl, ρ, between items across persons ‘not low’?” • Ans to Qu: It depends on ρ and k.
Summary (cont’d) • Reliability of a test increases with the length, k, and the internal consistency, ρ, of the test (Spearman-Brown formula) • Reliability is reduced when we reduce the range of X • The estimated correlation, rAY, between some ‘interesting’ variable, Y, and the latent construct, A, that is measured by X, increases as the reliability of X increases.
Appendix • R script, ‘sintraclass1.r’, showing different versions of ICC, each justified by its own ANOVA model
rep1rep2rep3 P18.06.28.4 P27.49.88.5 P310.47.59.1 P44.63.75.6 P59.59.79.9 P69.28.68.6 P75.34.75.5 P86.67.96.9 P94.26.93.6 P105.46.46.9 P116.96.910.2 P1210.610.611.6 P1311.511.611.3 P146.38.26.8 P157.59.79.0 • (Data file in ‘short’ form, but note that “rep1” may not be the same rater in the different rows! The ‘long’ form needed for ANOVA is on next slide, with 45 rows and each column being a variable or factor)
rating patient replic (== rater) 1 8.0 1 1 2 7.4 2 1 3 10.4 3 1 .. .. .. .. 16 6.2 1 2 17 9.8 2 2 18 7.5 3 2 .. .. .. .. 9 8.4 1 3 10 8.5 2 3 11 9.1 3 3 .. .. .. .. 43 11.3 13 3 44 6.8 14 3 45 9.0 15 3
R script, ‘sintraclass1.r’ #Script to generate the patient-as-random-effect data in a 15x3 2-way design with n=1. Then check that various formulae for ICC give same results. library(lme4) #Need to install 'lme4' package for mixed models ANOVA library(psych) #contains ICC() e0 = matrix(rnorm(45), ncol=3) #Errors for 15x3 matrix p0 = matrix(2*rnorm(15), ncol=3, nrow=15) #Patient random effects d0 = round(data.frame(8 + p0 + e0), 1) #Obs scores rownames(d0) = paste('P',1:15,sep='') colnames(d0) = paste(’rep',1:3,sep='') #Data in ‘long’ form for random effects model d00 = as.matrix(d0) d1 = data.frame(cbind(c(d00), rep(1:15,3), rep(1:3, each=15))) colnames(d1) = c("rating","patient",”replicate")
#Reverse order (D1,D2) pairs and find cor. Use ICC() to check. x1 = c(d0[,1], d0[,2]); y1 = c(d0[,2], d0[,1]) icc0 = round(cor(x1, y1), 2) cat('ICC12 as correl across 2n pairs = ', icc0) d01 = d0[,1:2] #D1, D2 ratings icc1 = ICC(d01) #ICC() returns a list; icc1[[1]] contains ICC cat('ICC12, judges fixed, = ', icc1[[1]]$ICC[3]) #icc1[[1]]$ICC[3] should = icc0 cat('ICC12, judges random, = ', icc1[[1]]$ICC[2]) #icc1[[1]]$ICC[3] = icc1[[1]]$ICC[2]?? #Also calculate the average of ICC12, ICC13 & ICC23; compare with icc2 below icc2 = ICC(d0) #Reliability for ratings from all 3 doctors cat("Whole sample ICC = ", icc2$ICC[2]) Results for a similar data set with 3 raters: • ICC12 as correl across 2n pairs = 0.77 • ICC12, judges fixed, = 0.77 • ICC12, judges random, = 0.78 • Whole sample ICC = 0.7 • Average ICC = 0.7 (ICC13=.6, ICC23=.73)
cat('Compute ICC from ANOVA table') cat('ICC = (F-1)/(F+k-1)') rs0 = lm(rating ~ patient, data=d1) #This fixed-effects model is not exactly right, but it gives the right F print(anova(rs0)) Results: Compute ICC from ANOVA tables: ICC = (F-1)/(F+k-1) Analysis of Variance Table Response: rating DfSumSqMeanSqFvaluePr(>F) patient14181.7712.9848.09459.527e-07 *** Residuals3048.121.604 (F-1)/(F+k-1) = (8.09-1)/(8.09+3-1) = 0.70, which agrees with the ‘whole sample’ ICC.
cat('Compute ICC from ANOVA table') cat('ICC = var(p)/[var(p)+var(resid)]') rs1 = lmer(rating ~ (1 | patient), data=d1) #This random-effects model is the right model print(summary(rs1)) Results: Linear mixed model fit by REML Formula: rating ~ (1 | patient) Random effects: Groups Name Variance Std.Dev. patient (Intercept) 3.79321.9476 Residual1.60401.2665 Number of obs: 45, groups: patient, 15 ICC = var(p)/[var(p)+var(resid)] = 3.79/(3.79+1.60) = 0.70, as before
Given in the ICC() output are the reliability of a test consisting of 1 item, and that of a test consisting of k items. • The relation between these 2 indices is given by the Spearman-Brown formula, which will be derived later on. • Most often, the index of choice is Cronbach’s alpha for a test with k items. This is ICC3K in the output from ICC().