Download
1 / 9
90 likes | 278 Views
Graphing Two-Variable Inequalities (Day 7) . We are learning to…graph inequalities with two variables on a coordinate plane. Wednesday, March 12, 2014. The graph of: y =-2 x +3 . Graphing Two-Variable Inequalities. Is (-1, 5) a solution to the function?

E N D
Graphing Two-Variable Inequalities (Day 7) We are learning to…graph inequalities with two variables on a coordinate plane. Wednesday, March 12, 2014
Graphing Two-Variable Inequalities • Is (-1, 5) a solution to the function? • How can you tell by just using the graph? • How can you tell by the equation? • Is (2, -1) a solution to the function? • What about (0, 0)? • What determines if a points lies on the line? • What is the different between the points on the line and the points not on the line?
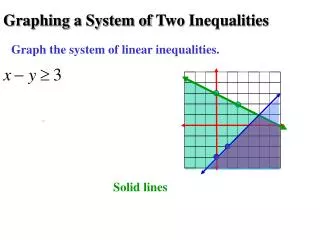
The graph of:y ≥-2x+3 • Your team will be given a list of points to test in the inequality y ≥-2x+3. For each point that makes the inequality true put a point on the board using a marker for our class graph. How could we accurately show ALL the solutions are to this inequality on the graph?
Graphing Two-Variable Inequalities • With your teammates predict what the inequality y < -2x + 3 will look like when it is graphed on a coordinate plane? How will the graph of y < -2x + 3 be different from the graph of y≥ -2x + 3?
The graph of:y <-2x+3 • Test your points again for the inequality y < -2x+3. For each point that makes the inequality true put a point on the board using a marker for our class graph. Name two different way that the graph of y < -2x + 3 is different from the graph of y ≥ -2x + 3. How can we show that solutions are not on the line?
Graphing Two-Variable Inequalities • Steps for graphing inequalities with two variables: • Step 1: Find inputs and outputs for the inequality and plot them on the coordinate plane • Step 2: Decide if the line needs to be solid or broken (dashed) • If > or < then use a broken line • If≥ or ≤ then use a solid line • Step 3: Choose a point above the line and below the line and test each in the inequality. • Step 4: Shade the correct solution area on the graph.
Graph the inequality y < 3x - 5 Test: Above the line (0, 0) 3(-1) – 5 -3-5 -1 -8 0 < 3(0) - 5 3(0) – 5 0-5 0 -5 0 < -5 3(1) – 5 3-5 Below the line (7, 0) 1 -2 3(2) – 5 6-5 2 0 < 3(7) - 5 1 0 < 16 3(3) – 5 9-5 Will the line be solid or broken? 3 4 Shade below the line! BROKEN LINE!
Graphing Two-Variable Inequalities • Try graphing a few inequalities with two variables with your team.