Graphing Inequalities
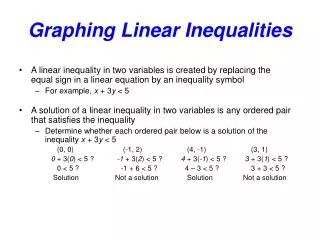
Graphing Inequalities. Standard: Solve and graph inequalities in one variable. Essential Question: How can I graph an inequality?. An inequality is a sentence that contains a <, >, < , or > sign. Examples: x < 3 is read “x is less than three” x > 3 is read “x is greater than three”

Graphing Inequalities
E N D
Presentation Transcript
Graphing Inequalities Standard: Solve and graph inequalities in one variable. Essential Question: How can I graph an inequality?
An inequality is a sentence that contains a <, >, <, or > sign. Examples: x < 3 is read “x is less than three” x > 3 is read “x is greater than three” x< 3 is read “x is less than or equal to three” x> 3 is read “x is greater than or equal to three”
To graph x < 3, put at least 3 points on the number line with 3 (boundary point) in the middle. Place one number less than the boundary point and one number greater than the boundary point. 2 3 4
Then circle the boundary point. Since x < 3, this means that the values for x can be any number less than 3. Show this on the graph by shading numbers less than 3. 2 3 4
To graph x > 3, put at least 3 points on the number line with 3 (boundary point) in the middle. Place one number less than the boundary point and one number greater than the boundary point. 2 3 4
Then circle the boundary point. Since x > 3, this means that the values for x can be any number greater than 3. Show this on the graph by shading numbers greater than 3. 2 3 4
To graph x < 3, put at least 3 points on the number line with 3 (boundary point) in the middle. Place one number less than the boundary point and one number greater than the boundary point. 2 3 4
Then circle the boundary point. Since x < 3, this means that the values for x can be any number less than 3 or equal to three. Show this on the graph by shading numbers less than 3. How can we show that the solution could be equal to three as well? 2 3 4
Fill in the circle! 2 3 4
To graph x > 3, put at least 3 points on the number line with 3 (boundary point) in the middle. Place one number less than the boundary point and one number greater than the boundary point. 2 3 4
Try these on your own. a > 2 c < 5 x > -3 y < -10 2 < x < 5 m < -3 or m > 1