Download

1 / 7
70 likes | 233 Views
Graphing Linear Inequalities in Two Variables. Linear Equations in Two Variables. Linear inequality in two variables Written in the form Ax + By < C OR A , B , C are real numbers, A and B are not both 0 Could use (>, , ) in place of <

E N D
Linear Equations in Two Variables Linear inequality in two variables • Written in the form Ax + By < C OR • A, B, C are real numbers, A and B are not both 0 • Could use (>, , ) in place of < An ordered pair is a solution of the linear inequality if it makes the inequality a true statement.
Linear Equations in Two Variables To Graph a Linear Inequality • Graph the related linear equality (forms the boundaryline). • and are graphed as solid lines • < and > are graphed as dashed lines • Choose a point not on the boundary line & substitute into original inequality. • If a true statement results, shade the half-plane containing the point. • If a false statements results, shade the half-plane that does NOT contain the point.
Linear Equations in Two Variables y (0, 0) x Example 1 • Graph y • as a dashed line. • Pick a point not on the graph: (0,0) • Test it in the original inequality. • True, so shade the side containing (0,0). Graph y
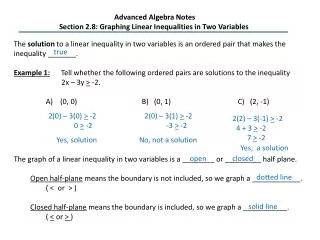
Linear Equations in Two Variables y (0, 0) x Example 2 • Graph 3x + 5y = –2 as a solid line. • Pick a point not on the graph: (0,0), but just barely • Test it in the original inequality. • 3(0) + 5(0) –2 • 0 –2 • False, so shade the side that does not contain (0,0). Graph 3x + 5y–2
Linear Equations in Two Variables y (0, 0) x Example 3 • Graph 3x = 15 as a dashed line. • Pick a point not on the graph: (0,0) • Test it in the original inequality. • 3(0) < 15 • 0 < 15 • True, so shade the side containing (0,0). Graph 3x < 15
Linear Equations in Two Variables Warning! Note that although all of our examples allowed us to select (0, 0) as our test point, that will not always be true. If the boundary line contains (0,0), you must select another point that is not contained on the line as your test point.