Graphing Linear Inequalities in Two Variables
200 likes | 496 Views
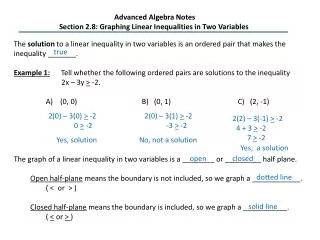
Graphing Linear Inequalities in Two Variables. Section 2.8. Review. Which of the following ordered pairs is a solution of 2 x + 5y > 9 ? (–4, –1) (–2, 3) (2, –4) (6, –1). Steps in Graphing. Draw the graph either applying slope–intercept or quick graph form

Graphing Linear Inequalities in Two Variables
E N D
Presentation Transcript
Graphing Linear Inequalities in Two Variables Section 2.8
Review Which of the following ordered pairs is a solution of 2x + 5y > 9 ? • (–4, –1) • (–2, 3) • (2, –4) • (6, –1) 2.8: Graph Linear Inequalities in Two Variables
Steps in Graphing • Draw the graph either applying slope–intercept or quick graph form • When using “cover–up,” if there is a negative coefficient in the y, flip the direction of the graph • Determine what the sign is and graph the line • Dotted Line: Greater, Less, or not–equal to • Solid Line: Greater then OR equal to, Less than OR equal to, Equal to • Shade above or below the line by looking at inequality 2.8: Graph Linear Inequalities in Two Variables
Steps in Graphing Greater Than shade u > > 2.8: Graph Linear Inequalities in Two Variables
Steps in Graphing Less Than shade own < < 2.8: Graph Linear Inequalities in Two Variables
Example 1 Graph 2x + 3y <6 Graph, as if, it was an equality. OR (3, 0) and (0, 2) 2.8: Graph Linear Inequalities in Two Variables
Example 2 Graph –4x – 2y > 8 OR (–2, 0) and (0, –4) 2.8: Graph Linear Inequalities in Two Variables
Example 2 Calculator Graph –4x – 2y > 8 Must be in slope–intercept form Go to Y= in graphing calculator Greater than Less than 2.8: Graph Linear Inequalities in Two Variables
Example 2 Calculator Graph –4x – 2y > 8 2.8: Graph Linear Inequalities in Two Variables
Example 3 Graph y >4 2.8: Graph Linear Inequalities in Two Variables
Example 4 Graph x <7 2.8: Graph Linear Inequalities in Two Variables
Your Turn Graph 3>3/2y y< 2 2.8: Graph Linear Inequalities in Two Variables
Example 5 Graph 2/3 (2x – y) < 2 y > 2x – 3 2.8: Graph Linear Inequalities in Two Variables
Example 6 You have two part–time summer jobs, one that pays $9 and hour and another that pays $12 an hour. You would like to earn at least $240 a week. Write an inequality describing the possible amounts of times you can schedule at each jobs. Graph the inequality. Each space is worth 5. $12 an hour job (every 5) $9 an hour job (every 5) 2.8: Graph Linear Inequalities in Two Variables
Your Turn A pizza place has 4800 ounces (300 pounds) of dough. A small pizza uses 12 ounces of dough and a large pizza uses 18 ounces of dough. Write and graph an inequality describing the possible numbers of small and large pizzas that can be made. Each space is worth 50. Large Pizzas (per 50) Small Pizzas (per 50) 2.8: Graph Linear Inequalities in Two Variables
Assignment Page 135 3–27 odd, 43–47 odd 2.8: Graph Linear Inequalities in Two Variables