Let sample from N( μ , σ ), μ unknown, σ known.
CONFIDENCE INTERVAL FOR MEAN WITH KNOWN σ – choice of the sample size for a given margin of error. Let sample from N( μ , σ ), μ unknown, σ known. The margin of error m= half-length of the CI for μ , m = depends on:

Let sample from N( μ , σ ), μ unknown, σ known.
E N D
Presentation Transcript
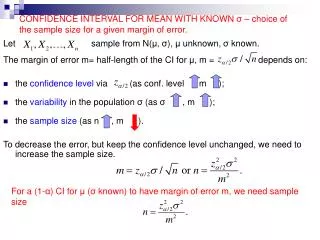
CONFIDENCE INTERVAL FOR MEAN WITH KNOWN σ – choice of the sample size for a given margin of error. Let sample from N(μ, σ), μ unknown, σ known. The margin of error m= half-length of the CI for μ, m = depends on: • the confidence level via (as conf. level , m ); • the variability in the population σ (as σ , m ); • the sample size (as n , m ). To decrease the error, but keep the confidence level unchanged, we need to increase the sample size. For a (1-α) CI for μ (σ known) to have margin of error m, we need sample size
Example Suppose are heights from a normal distribution with σ=10’’. In a sample of size 16 we obtained . a) Find a 95% confidence interval for μ. What is its margin of error? b) Find the sample size needed for the margin of error to be 3 inches. Solution. σ =10’’, n=16, m=3. a) C = 0.95, so α = 0.05, so zα/2=1.96. 95% CI for the mean (sampling from normal distribution) is: =(60 +/-1.96(10)/√16) = (55.1, 64.9). Margin of error=(64.9 - 55.1)/2 = 4.9. b) Finally, n = 43. We need a larger sample size to get smaller error, with the same confidence level. X, scores on a test, have a normal distribution with unknown mean and σ = 60. The sample values X1, X2, …, X900 give sample mean Find a 95% as well as 98% confidence intervals for the true mean test score. Solution. Point estimate of μ is n=900, σ = 60. For 95% CI, zα/2=1.96, so 95% CI is: =(272 - 1.96(60/√900, 272 + 1.96(60/√900) = ( 268.08, 275.92). For 98% CI, zα/2=2.33, so 98% CI is: =(272 – 2.33(60/√900, 272 + 2.33(60/√900) = ( 267.35, 276.65). Note that the 98% CI is longer than the 95% CI. We gained confidence, but we lost accuracy.
CONFIDENCE INTERVAL FOR MEAN WITH UNKNOWN σ If the population variance σ is unknown, estimate is using the sample variance S: Then, replace σ with S in the Z-statistic used for the confidence interval: Get t-statistic: The t-statistic does not have standard normal distribution. It has a t distribution with (n-1) degrees of freedom. The number of degrees of freedom is a parameter of the t distribution. NOTE. T-distribution is also called “Student’s t distribution”.
T-distribution As degrees of freedom increase, t distribution becomes indistinguishable from standard normal. See last row of t- table (back cover of text book). T-distribution has similarities and differences with standard Normal distribution: symmetric around zero, but it has fatter (heavier) tails.
CONFIDENCE INTERVAL FOR MEAN WITH UNKNOWN σ Following a procedure similar to the one for constructing CI for μ when σ was known, when data was from a normal population, we can find a CI for μ when σ is not known. We replace σ with S and standard normal percentiles with percentiles from t distribution. Let be observations from a normal distribution with mean μ and standard deviation σ, both μ and σ unknown. A C=(1-α) confidence interval for μ is given by when the data is from a normal population with σ unknown. Here tα/2 satisfies P(t(n-1)>tα/2 )=α/2, i.e. tα/2 is a percentile from t(n-1) distribution. We use t-table or a statistical computer package (e.g. MINTAB) to find percentiles of t-distribution: tα/2.
EXAMPLE A biologist studying brain weights of tigers took a random sample of 16 animals and measured their brain weights in ounces. This data gave a sample mean of 10 and standard deviation of 3.2 ounces. Assuming that these weights follow a Normal distribution, find a 95% confidence interval for the true mean tiger brain weight μ. Solution. =10, s=3.2, n=16, need 95%CI for μ. C=0.95, so α=0.05, so α/2=0.025. Since n=16, then n-1=15. We need t(15)0.025. From the table t(15)0.025=2.131, so the 95% CI for μ is: 10+/- 2.131 (3.2)/√16 = (8.295, 11.705) oz. We are 95% confident that the true mean weight of a tiger brain is between 8.295 and 11.705 oz.
MINITAB EXAMPLES. EXAMPLE 1 A graduate class in probability theory was running in a university for several years. The professor wanted to estimate the average final exam results. She took a sample of 25 exams. Find a 90% CI for the true mean final score for this course. Solution: I used MINITAB (data available on class web site probs.xls). We do not know population st. deviation, so we need to use t-distribution to get CI. MINITAB output in the “Session” window T Confidence Intervals Variable N Mean StDev SE Mean90.0 % CI score 25 84.68 5.72 1.14 ( 82.72, 86.64) In the output: SE Mean = estimate of the Standard Error of the Mean = estimate of
MINITAB EXAMPLES. EXAMPLE 2 A 100 observations was collected on test results for a precalculus class. Find a 98% confidence interval for the true mean test score for that class. Solution. I used MINITAB. (data available on class web site precalc.xls). T Confidence Intervals Variable N Mean StDev SE Mean 98.0 % CI score 101 69.64 10.99 1.09 ( 67.05, 72.23) Answer: The 95% CI for the true mean score for the precalculus class is (67.05, 72.23)