Data Display
Data Display. Scientific Research Methods in Geography Chapter 10 Feb 9, 2010. Data Display…. … is a Graphical Technique for communication and analysis that depicts data patterns rather than literally describing them.


Data Display
E N D
Presentation Transcript
Data Display Scientific Research Methods in Geography Chapter 10 Feb 9, 2010
Data Display… • … is a Graphical Technique for communication and analysis that depicts data patterns rather than literally describing them. • … allows relevant properties of phenomena to be highlighted and clarified. • … is used by scientists for several purposes including: • Initial data examination • Interpret the meaning of data • Communicate data and meaning to others.
Guidelines for Designing Displays • Guiding principles for the design and use of data displays boil down to one underlying idea: Effective Communication. • Effective Communication means - Communicating a great deal of truthful and relevant information in a manner that is: • Clear • Accurate • Unambiguous • Efficient • Aesthetically Pleasing
Tables • Organized lists, arrays, or matrices of data. • Show data values directly with numbers. • Only minimal use of spatiality. • Tables Depict Data in Two Ways: • Distribution Tables • Show Frequency • Relative frequency, cumulative frequency • Contingency tables • Descriptive Index Tables • Shows tendency, variability, relationship
Tables continued • Metric-level data in tables • Grouped into classes or intervals to efficiently communicate the pattern of the data. • “Class Intervals” • How many classes are appropriate: • At least 3 or 4 and probably no more than 10 • Specific to the data set and what is intended to be communicated
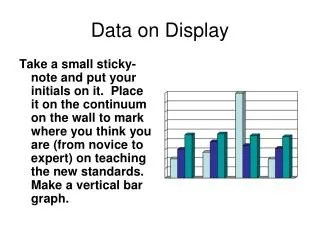
Graphs • Pictorial representations of data. • The use of spatial properties such as: • Location • Size • Distance • Direction • 3 Dictums to follow from table 10.1: • Label Clearly and Sufficiently • Avoid Uninformative and Content-Free Graphic Marks • Fill the Graph Space with Data Marks
Maps • In this context… maps are graphical displays that depict earth-referenced features and data. • “Take at least one Cartography Course” • Reference Maps: • Depict actual earth surface features as accurately as possible • Locations are encoded with a coordinate system • Thematic Maps • Special purpose displays • Hybrid “map-graph” that uses geographic space as a base
Maps always distort the earth’s surface and features. • Generalizations need to be made when creating a map. Not all levels of detail can be depicted on a map. • Symbology and Color schema are important to consider. • Sometimes Distortions are part of the communication. (http://www.math.yorku.ca/SCS/Gallery/images/cartogram/statecartredblue.png) (http://blogs.sas.com/jmp/uploads/choropleth1.png)
New Trends in Scientific Visualization • Information Visualization is key to exploratory data analysis, especially with large spatially and temporally distributed data sets. • Buzzwords: • Geo-visualization • Spatialization • Animations • Augmented Reality / Virtual Reality • Multisensory display technologies: sonificationtactilizations • Bottom Line: No matter how “gee whiz” the visualization technique is, it needs to meet the requirements of effectively communicating data.
Class Exercise • Think of a Data Display example that you have created or viewed that is particularly effective. What made it effective? • Can you reproduce it on the white board?