1 / 9

Understanding Data Variability with Box and Whisker Plots

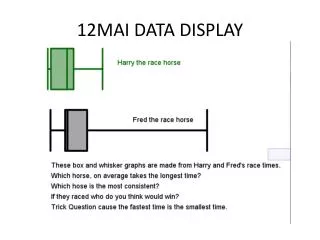
Learn how to interpret data spread using box and whisker plots showcasing values' variability and central tendency, including range and median.

aneko
Download Presentation

Understanding Data Variability with Box and Whisker Plots

An Image/Link below is provided (as is) to download presentation Download Policy: Content on the Website is provided to you AS IS for your information and personal use and may not be sold / licensed / shared on other websites without getting consent from its author. Content is provided to you AS IS for your information and personal use only. Download presentation by click this link. While downloading, if for some reason you are not able to download a presentation, the publisher may have deleted the file from their server. During download, if you can't get a presentation, the file might be deleted by the publisher.

E N D

Presentation Transcript


  1. 12MAI DATA DISPLAY

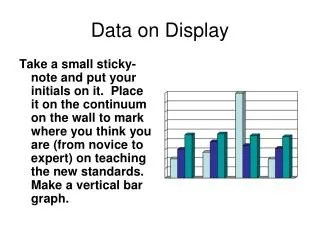
  2. Box and Whisker • Length = the spread of the data: how variable/changeable/different the values are. • Interquartile range is the length of the box. • The middle line is the median which measures central tendency and the further up the scale the bigger the values on average.

More Related