Tabular Display of Data
240 likes | 654 Views
Tabular Display of Data. Prepared by: Gary Klass gmklass@ilstu.edu. Data Presentation Standards “Graphical Excellence” -- Edward Tufte. well-designed presentation of data of substance, statistics and design complex ideas communicated with clarity, precision and efficiency

Tabular Display of Data
E N D
Presentation Transcript
Tabular Display of Data Prepared by: Gary Klassgmklass@ilstu.edu
Data Presentation Standards“Graphical Excellence” -- Edward Tufte • well-designed presentation of data of substance, statistics and design • complex ideas communicated with clarity, precision and efficiency • the greatest number of ideas in the shortest time with the least ink in the smallest space.Best example: Baseball statistics
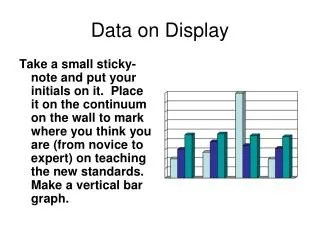
Meaningful Data • Count • Divide • Compare
Meaningful Data (contd.) • Use rates, ratios and per capita measures rather than aggregate totals. • Two time points are better than one. • Show change over a meaningful time period. (5 year change rather than annual change). • Multi-year trends are best presented in time series charts rather than tables. • Show the source of the data
Draw Conclusions from Meaningful Comparisons • One year changes in crime rates are not very meaningful • Rates (and averages) tell more than counts(crimes rates, not crime counts)
Unambiguous Data • Each number in a table should have a precise meaning. • Use titles, headings, and notes to clearly define the data. • Be precise when using rates and ratios • Clearly define the numerator and denominator of the measures • Be clear about percent change, net percentage change. • Abortion rate vs. Abortion ratio • % of poor vs. the % that are poor • Net change vs. % percentage change
Unambiguous Data Change in Teenage Birth Rates: 1987-1998 White 6.7% Black -4.9 Asian -1.8 Hispanic 3.7 Source: Statistical Abstract 2000, table 85
Efficiency Data can be quickly interpreted by the reader. • Sort data on the most meaningful variable • Time always left to right • Similar data goes down the columns • Highlight important comparisons • Don’t force comparisons between two different tables • Consistent formatting across tables
Excel skills • Combine cells for title, use word wrap • Adjust cell widths • Sort data • Use formulas and copy formulas • Do not use too many fonts • Decimal places: 2 significant digits • Horizontal borders • Copy image to Word