Introduction to:
Introduction to:. a suite of interactive modeling solutions for seismic survey planning and interpretation. -2D -2.5D - Pro. time field of incident waves. AVO curve. What you can do with the package .

Introduction to:
E N D
Presentation Transcript
Introduction to: a suite of interactive modeling solutions for seismic survey planning and interpretation -2D -2.5D - Pro
time field of incident waves AVO curve What you can do with the package • With Full-wave modeling you can model the gathers and time sectionsfor explosive and surface sources with custom wavelet for: • Rough topography, various near-surface conditions, surface_waves, refractions, etc. • Thin-layered modelsthat are build on the basis of well-log data. • Complex anisotropy:transversally isotropic media and fracturing systems. • Porous fluid-saturated media (Gasman approximation). • Also, basing on Full-wave modelingmay be done: • AVO analysisforanisotropic, porous, fluid-saturated, viscoelastic, thin-layered media. • Q-factor estimationfor thin-layered media by VSP and well-log data. • Processing:post-stack, pre-stackdepth and time migrations for surface and VSP data. • Buildingvelocity model by seismic data The package also allows producing and studying: Synthetic shotgather and wavefield snapshots Seismic images from synthetic and real data
Interactions with the package Model building Arrival time & Energy fields Resulting seismic images Synthetic shotgathers Wavefield snapshots Velocity by seismic data
●Modelbuilder • Creation of thin-layered model by well-logs (LAS files • Modelbuilding using raster image • Modelbuilding using data in grid formats
What wavelets are used? Approximation of user custom wavelet with Puzirov wavelet Approximation of user custom wavelet with Rikker wavelet
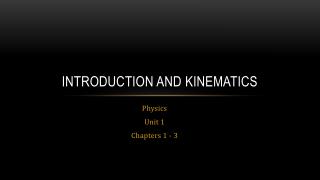
1000 0 1500 4500 5500 -500 500 2000 2500 3000 3500 4000 5000 0 10 SK 0.4 XV X 2 7 0.8 3 1 6 1.2 5 Zv 1.6 4 2.0 2.4 G 8 G1 9 2.8 (P1S1) (P1P1) (P1P2) (P1S2) RK RK RK RK Modeling for development of advanced processing procedures Synthetic shotgather, which demonstrates duplex waves originated on vertical layer 80 m thickness (previous slide), at coordinate X=4000m. Legend: 1 – reflections from base boundary; 2 – compressional duplex wave, reflected from nearest to the source side of a vertical layer; 3 – compressional duplex wave, reflected from a far side of a vertical layer; 4 – converted duplex wave, reflected from nearest to the source side of a vertical layer; 5 – converted duplex wave, reflected from a far side of a vertical layer; 6 – converted duplex wave, transmitted through the vertical layer; 7 – compressional duplex wave, transmitted through the vertical layer; 8 and 9 - reflected duplex waves, originated from PS-wave, which changed mode on a base boundary; 10 – transmitted duplex wave, originated on top of a vertical layer as result of incidence on it of direct compressional wave. Scheme of origin of reflected and transmitted waves on thin vertical layer
Effect of LVZ surface waves and uneven surface on CDP data imaging Synthetic time cross-section.The receiver grouping base 150 m With ellipse are shown zones of seismic image distortions caused by LVZ conditions, which erroneously could be interpreted on real data.
Seismic imaging for post-stack interpetation CMP stack Initial model Pre-stack Kirchhoff migration (depth scale)
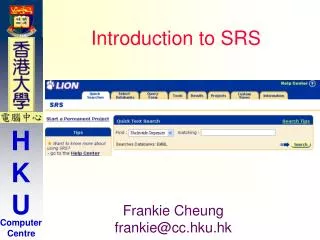
Modeling ofcomplexly built medium “MARMOUSI” SEGY-Model with ellipse is shown target “gas deposit” Maximum Energy (E)
Modeling of TTI-anisotropy and fracturing Depth pre-stack migration (VWKM) taking anisotropy into account for the best possible case scenario – exact velocity model and data. Imaging without anisotropy
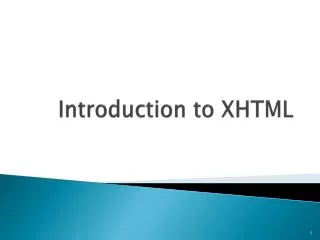
1 - Vp=2177 m/s Vs=888 m/s ρ =2160 kg/m3 2 - Vp=1967 m/s Vs=1312 m/s ρ =2050 kg/m3 3 - Vp=2131 m/s Vs=869 m/s ρ =2100 kg/m3 4 - Vp=2177 m/s Vs=888 m/s ρ =2160 kg/m3 AVO-modeling in conditions of thin-layered, anisotropic, fractured, viscous-elastic media а b MODEL Transmitted wave Receivers Reflected wave Z-comp. c d α° K=K(α) X-comp. - - - - AVO-dependency Modeling of AVO-effect for the flat target reflecting boundary with homogeneous upper thickness. Legend:a -model; b, d – shotgather for Z- and X-component; c - AVO-dependency graph.
Why you need Full-wave modeling in seismic … 4+ Product stable applications 3+ Product stable progress 2 Product multiple successes 6 Reborn Product stable applications 1 Product first successes Revenues 5 Reborn Product multiple successes & progress 3- Product numerous failures 0 Product initial development 4- Product Oblivion Time Product/Site TypicalDevelopment & Revenues time curve +via modeling and testing; - via trial-and-error method
Tesseral-Pro : Modeling solutions for 2D & 3D seismic surveys Improved thin-layer 3D model building … “Tesseral Pro” provides improved thin-layer model building on the base of collected well log information, utilizes complex well information including well logs, their interpretation, strata boundaries, well coordinates and inclinometer data about the well geometry. “Tesseral Pro” can be used for graphical document design compound from sections, surfaces, 3D plots, seismograms and seismic sections, text fields, pictures, etc.
Tesseral-Pro : Modeling solutions for 2D & 3D seismic surveys Ray-tracing as interpretational tool 3-D visualization of seismic files, wells and horizons. 2-D, 2.5-D and 3-D gathers, depth migrated cubes and sections, velocity cubes can be shown either by traces or more sophistically by their vertical sections, horizontal section and sections along a horizon map Time field based 2-D anisotropic ray tracing modeling in addition to the finite-difference modeling methods. One time reflected waves ray tracing supports both compressed and converted waves on the base of time fields.
Summary • Full-wave modeling is a tool for improving the quality and reliability of the interpretation of seismic surveys. It is particularly helpful for planning acquisition parameters, fine-tuning of the processing sequence... • Full-wave modeling may be especially helpful for interpreters working with seismic record dynamics, i.e. AVO analysis, multi-component acquisition (polarized seismic prospecting) ... • Full-wave modeling allows consistently analyze characteristics of seismic records for complexly structured geological media including: thin- and sub-vertical layering, abrupt velocity changes in all directions, anisotropy and fracturing systems… • Tesseralis easy to use visual learning tool. It can help geoscientists in developing and testing seismic processing procedures and sequences, to better understand wave phenomena in geological media and the specifics of the seismic exploration methods, and to present results in visual and consistent form for decision-making… www.tesseral-geo.com