Download
1 / 28
280 likes | 397 Views
The Integrated Global Carbon Observatory (IGCO) aims to improve our understanding of the global carbon cycle and its relationship to climate change. With contributions from leading scientists, this initiative focuses on long-term observations to monitor carbon sources and sinks at multiple scales. The IGCO employs various methodologies, including satellite and in-situ measurements, to assess atmospheric CO2 levels and evaluate the effectiveness of carbon mitigation strategies. This comprehensive data informs international climate policies and fosters effective response measures to carbon emissions.

E N D
Global CarbonObservatory Pep CanadellGCP-CSIRO Marine and Atmospheric ResearchWith contributions and thanks to:Philippe Ciais, David Crisp, Roger Dargaville, Stephen Plummer, Michael Raupach Integrated Global Carbon Observations - IGCO
Outline • Goals and Vision for a global C observatory • Major types of observations • Satellite observations • Carbon from space: OCO, GOSAT • In situ observations • Process understanding • Linking observations to processes • Fundamental research and model development
1. Goals and Vision of a Carbon Observatory • To provide the long-term observations required to improve understanding of the present state and future behavior of the global carbon cycle, particularly the factors that control the global atmospheric CO2 level and feedbacks to climate. • To measure carbon sources and sinks from global to regional scales in a way that can inform the development of international climate treaties, and methodologies for national GHGs budgets and domestic policies. • To monitor and assess the effectiveness of carbon sequestration and/or emission reduction activities on global atmospheric CO2 levels, including attribution of sources and sinks by region and sector. IGCO 2004, GCP 2003
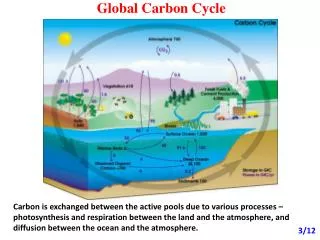
Georeference emissions inventories Atmospheric measurements Remote sensing of Atmospheric CO2 Data assimilation link optimized model parameters optimized fluxes Climate and weather fields Eddy-covariance flux towers Ocean time series Biogeochemical pCO2 Rivers Biomass soil carbon inventories Lateral fluxes Coastal studies Surface observation pCO2 nutrients Ecological studies Remote sensing of Vegetation properties Growth Cycle Fires Biomass Radiation Land cover /use Ocean remote sensing Ocean colour Altimetry Winds SST SSS Water column inventories Vision for a Carbon Cycle Model-Data Assimilation System Atmospheric Transport model Ocean carbon model Terrestrial carbon model IGCO 2004
1980-2000 Mean Net Flux to the Atmosphere (gC m-2 y-1) Multiple Constraints Data Assimilation for Carbon Cycle Continental to Sub-continental Resolution Data Assimilated: • Atmospheric [CO2 ] • AVHRR - PAR • 12 Functional Veg. Types • Models: • atmospheric transport model • terrestrial biosphere (BETHY) • TransCom resolution • Transport Model • Atmospheric CO2 Rayner et al. 2005
2. Types of Observations Complementary core groups of observations to address three themes: • Fluxes: observations to enable quantification of the distribution and variability of the CO2 fluxes between the Earth’s surface and the atmosphere. • Pools: Observations on changes in the atmospheric, oceanic, and terrestrial reservoir carbon pools. • Process: Measurements related to the important carbon cycle processes that control fluxes.
Fluxes • Land-atmosphere CO2 flux measured via eddy covariance flux network • Atmospheric CO2concentration measured from in situ networks • Atmospheric column CO2concentration measured from satellites Global, synoptic satellite observations to extrapolate in situ data Carbon storage in the sediments of reservoirs, lakes • Carbon storage in anthropogenic pools, primarily wood products • Soil carbon inventories • Forest biomass inventories Pools IGCO 2004
Fluxes Global, synoptic satellite observations to extrapolate in situ data Winds, SST, SSS, ocean colour Basin-scale observations of the air-sea flux (ocean pCO2) from ship-based measurements, drifters and time series • Basin-scale ocean inventories with full column sampling of carbon system parameters Sediment trap and sea-floor studies, with a special emphasis on coastal sediments Pools IGCO 2004
3. Priorities for Satellite Observations New Measurements • Column-integrated atmospheric CO2 • Atmospheric CO2 and aerosols • Biomass burning CH4 emissions • Column integrated CH4 • Atmospheric structure, temperature, humidity, winds. • Land-cover change • Ecosystem disturbances • Directional reflectance • Ocean color • Ancillary terrestrial data • Ancillary oceanic data • Forest aboveground biomass • Wetland coverage Not new but require new spatial and temporal resolution, or better coordination IGCO 2004
CO2 from Space: Instruments Instrument Coverage Weight-func Hrl Res CO CH4 CO2 Precision TOVS trop monthly upper-trop 15 degs no no yes — SCIAMACHY global column 30×60 km yes yes yes 3-5ppm AIRS glob daily mid-trop 50 km yes yes yes 2ppm IASI glob daily mid-trop 50 km yes yes yes 2ppm CRIS glob daily mid-trop 50 km yes yes yes 2ppm OCO sunlit column 3-10 km2 no no yes 1–2ppm GOSAT sunlit column 100-1000 Km— yes yes 3–4ppm ACCLAIM glob weekly lower trop 100m no no yes 1ppm A-SCOPE glob weekly lower trop 100m no no yes 1ppm Peter Rayner 2005 (unpublished)
The Orbiting Carbon Observatory (OCO) Near Infrared Passive Sensor Launch – Sept. 2008 • Resolve pole to pole XCO2 gradients on regional scales • Resolve the XCO2 seasonal cycle • Improve constraints on CO2 fluxes (sources and sinks) compared to the current knowledge: • Reduce regional scale flux uncertainties from >2000 gC m-2 yr-1 to < 200 gC m-2 yr-1 • Reduce continental scale flux uncertainties below 30 gC m-2 yr-1 David Chris 2005
Uncertainy Reduction from Different Data Sources Data CO2 Inversions 2 weekly Houweling et al. 2005
4. Priorities for in situ observations • Atmospheric CO2 and Carbon Cycle Tracer Observations. • Eddy Covariance fluxes of CO2, H2O and Energy. • Large scale biomass inventories. • Large scale soil carbon inventories. • Ocean carbonates. IGCO 2004
Priority Pools and Processes Carbon-Climate Feedbacks Hot Spots Land Permafrost Oceans HL Peatlands CH4 HydratesBiological Pump Solubility Pump T Peatlands Veg.-Fire/LUC GCP 2005
Priority Pools and Processes Carbon-Climate Feedbacks Hot Spots Land Permafrost Oceans HL Peatlands CH4 HydratesBiological Pump Solubility Pump T Peatlands Veg.-Fire/LUC GCP 2005
Carbon-Climate Feedbacks 10 GCMs with coupled carbon cycle Coupled Climate-Carbon Difference Coupled-Uncoupled Atmospheric CO2 (ppm) 220 ppm NO processes on thawing frozen carbon NO processes on drained peatlands NO specific fire processes NO processes accounting for nutrient limitation (N, P) Friedlingstein et al. 2006
5. Attributing Major Processes to Fluxes • Core space based observation • Land-cover change • Disturbances (e.g., fire counts and burned areas) • Leaf Area Index and related biophysical processes • Ocean color (which relates to biological activity) • In situ observation related to processes Soil characteristics Water vapor and energy eddy covariance fluxes Phenology of the terrestrial biosphere Nutrient distributions and fluxes (ocean and land) Species composition of ecosystems Atmospheric tracers (O2:N2 ; 13C-CO2 ; CO ; aerosols).
Carbon Emissions from Fires Atmospheric Tracers: CO, CH4 Remote Sensing: Fire Spots, Burned Area C Flux Anomalies (gC/m2/yr) El Nino 1997-98 Fire C Emissions Anomaly (gC/m2/yr) El Nino 1997-98 1997-98 2.1 Pg C emissions from fires 66% of the CO2 growth rate anomaly 1997-2001 3.53 Pg C emissions from fires Rodenbeck et al. 2003; Werf et al. 2004
(17) Transport Models (TransCom) Fundamental process understanding & model development More Data is not Enough 4 ppm
Global Terrestrial Carbon Uptake (6) Dynamic Global Vegetation Models 7 PgCyr-1 Cramer et al. 2001
Biospheric Carbon Uptake (Pg C yr-1) 10 GCMs with coupled carbon cycle Land C Uptake Ocean C Uptake Land Uptake (Gt C/yr) 15 Pg 7 Pg Friedlingstein et al. 2006
Candidate Mechanisms of Current Terrestrial Sinks Driven by Atmospheric & Climate change • CO2 fertilization • Nitrogen fertilization • Warming and preciptation change • Regrowth in abandoned croplands • Fire suppression (woody encroach.) • Regrowth in previously disturbed forests • Logging, fire, wind, insects • Decreased deforestation • Improved agriculture • Sediment burial • Carbon Management (reforestation) Driven by Land Use Change Canadell et al. 2006
… will increase in the future if the important mechanisms are physiological (eg,CO2 Fertilization) …will decrease in the future if the important mechanism are due to the legacy of past land use (eg,regrowth, thickening..) Attribution of the terrestrial carbon sink The Terrestrial Carbon Sink… Sink strength Sink strength Climate warms as predicted Climate warms more rapidly than predicted
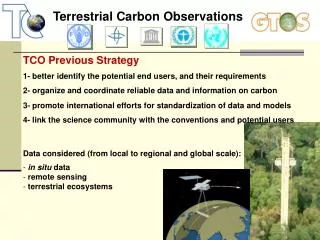
Terrestrial Carbon Observations Approach Scale RS [CO2] RS Measurements [CO2] Measuremts Biomass/NPP and soil inventories Continent Biome Regional campaigns Field experiments Disturbances Region Landscape Pools and Fluxes Process studies 1 km2 Eddy Covariance fluxes 1 ha Plot studies and experiments Modified from GTOS, Cihlar et al. 2001