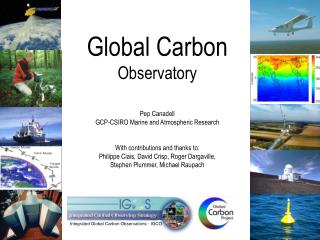
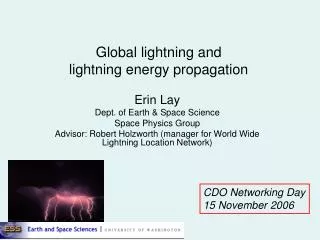
Global Observations of Lightning: Insights, Mechanisms, and Future Directions
This study reviews global lightning observations, focusing on electrical phenomena like streamers and sprites. It dissects the mechanisms behind lightning production, emphasizing the role of ice interactions in thunderstorms. We discuss advanced remote detection methods, including LIS and OTD, and present correlations between lightning activity and storm dynamics. Our findings highlight the integral relationship between lightning, thunderstorm updrafts, and hydrometeor characteristics. The insights gained are essential for improving weather forecasting and understanding severe weather phenomena.

Global Observations of Lightning: Insights, Mechanisms, and Future Directions
E N D
Presentation Transcript
Streamers, sprites, leaders, lightning: from micro- to macroscales • Remote detection of lightning - information provided • LIS and OTD - what they are and how they work • Results from global observations • Next generation • Change ?
+ + + + + + + + + + + + + + + + - - - - - - A schematic of grauple - ice crystal charge transfer in a thunderstorm Lightning production is related to microphysical and dynamic cloud processes. Ice interactions seem to play the major role in thunderstorm electrification. Particularly rebounding collisions of graupel and ice crystals – Non-inductive charging mechanism. Necessary conditions for thunderstorm electrification: a) strong enough up-draft to grow precipitation size ice. b) ice-graupel collisions in the presence of water
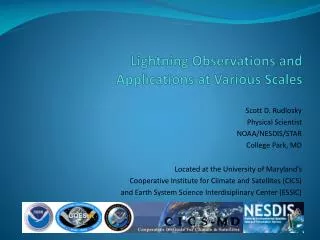
Lightning Connection to Thunderstorm Updraft, Storm Growth and Decay • Total Lightning —responds to updraft velocity and concentration, phase, type of hydrometeors — integrated flux of particles • WX Radar — responds to concentration, size, phase, and type of hydrometeors- integrated over small volumes • Microwave Radiometer — responds to concentration, size, phase, and type of hydrometeors — integrated over depth of storm (85 GHz ice scattering) • VIS / IR — cloud top height/temperature, texture, optical depth
Why observe lightning?(Forecasting) Tornado time Lightning Radar Time
Temperature Positive charge Positive charge Charging zone Negative charge Negative charge Positive charge F Positive charge Flux Hypothesis Hypothesis:Lightning frequency (F) proportional to product of upward non precipitation ice mass flux (I) and precipitation ice mass flux (p) F = c*p*I Supported by simple calculations (Blyth et al. 2001) and lightning model results (Baker et al. 1995, 1999). p
STEPS Results – 6 June 2000 ‘Garden Variety’ Single Cell Storm Lightning per radar volume time Non- Precipitation ice mass flux[g s-1m-2] * 1011 Precipitation ice mass flux [g s-1 m-2] * 1012
How good is the apparent correlation between lightning and IWP and how does it vary between regimes? Method • Create land, ocean, coastal data mask • Create scatter plot of data in previous figure (0.5 x 0.5o grid) for each partition Result • Noisy, but clear correlations above sample noise floor in flash density • Eyeball says best fit lines would be very similar
Clarify Signal: Ocean, Coast and Land IWP Binned by Flash Density (All rain certain pixels with detectable IWP included) TRMM PR IMP • When averaged, correlation is very strong, best fit lines independent of regime. • ~95% (75%) of oceanic (coast) flash density distribution in sampling noise (low flash density; <.007 fl/km2/day = 0.2 fl/km2/mo), low IWP (~.01-.02 kg/m2). Sampling + DE threshold + occurrence! • Similar functional relationships between rain (Iiquid) – lightning vary by regime.
Sample “Virtual radar” retrieval Truth (radar) Retrieval GPROF (cloud model) (µwave + lightning)
Instrument designChristian et al, J. Geophys. Res., 1989 • Fast lens, narrowband filter at 777.4 nm • 128 x 128 CCD array, 500 fps imaging • Frame-to-frame subtraction isolates lightning transients against bright daytime background
8 km 8 km 8 km nominal spatial resolution optimizes the lightning-to-background S/N ratio. Measurement: Spatial Discrimination
Measurement:Temporal Discrimination CCD integration interval is set to 2 ms to minimize pulse splitting between frames and minimize integration of background signal
Measurement: Spectral Filtering Narrow band interference filter passes only light from 1nm wide oxygen mutiplet
Lightning Detection from Low Earth Orbit Optical Transient Detector ( launched April, 1995 ) Lightning Imaging Sensor ( launched November, 1997 )
History: LIS (1997-present) • Lower orbit, smaller Field of View, tropical inclination
High Resolution Full Climatology Annual Flash Rate Global distribution of lightning from a combined nine years of observations of the NASA OTD (4/95-3/00) and LIS (1/98-12/04) instruments
Climatology: Diurnal cycle ( Local hour )
Climatology: Diurnal cycle ( UTC Hour )
Global lightning is modulated on annual & diurnal time scales, as well as seasonally and interannually
Winter 1998-99 (La Niña) Lightning Responsive to Interannual Variability Winter 1997-98 (El Niño)
Major Points for Severe Weather • Primary lightning signature is high flash rates and the “jump” • Lightning flash rate is correlated storm intensity - higher rate implies stronger storm. • Evolution of the lightning activity follows the updraft. Increasing activity means the storm intensifying; decreasing activity means the updraft is weakening. • A jump in lightning activity is associated with a pulse in updraft intensity • These signatures, in conjunction with other NWS assets can be used to: • Separate intensifying from weakening storms • Identify storms in process of going severe • Quickly determine the most intense storms in a complex system • Improved warning times • Reduced false alarms rates
Lightning Sensing from GEO • Climate Monitoring • Storm Development • Ice-phase precipitation estimates • Severe Weather Now-casting • Data assimilation and model inputs • Atmospheric chemistry
GLM : Field of View at GOES West and East • GOES W (75ºW) GOES E (135ºW) • OTD climatology indicates lightning density • Range rings indicate limits of 10, 15, 20, & 50 km pixel footprint