Download
1 / 8
80 likes | 226 Views
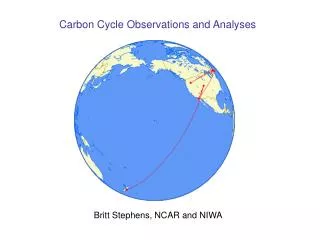
Carbon Cycle Observations and Analyses. Britt Stephens, NCAR and NIWA. Seasonal variations in O 2 and CO 2 in Southern Ocean Air Scripps Flask Network and Baring Head Continuous Measurements. Palmer Station minus Cape Grim and South Pole average.

E N D
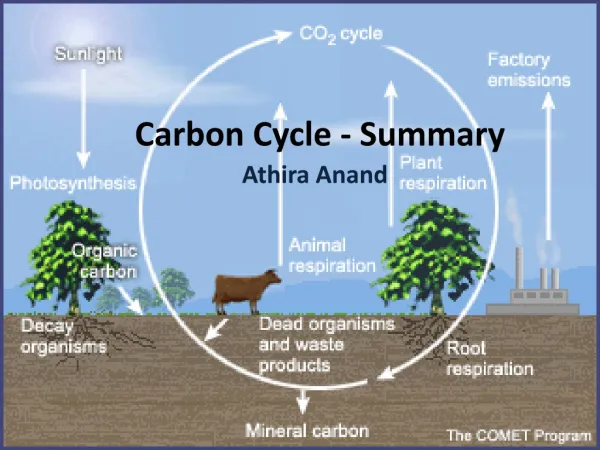
Carbon Cycle Observations and Analyses Britt Stephens, NCAR and NIWA
Seasonal variations in O2 and CO2 in Southern Ocean Air Scripps Flask Network and Baring Head Continuous Measurements Palmer Station minus Cape Grim and South Pole average Q1) Are global ocean biogeochemistry models accurately representing the complex thermal and biological influences in the Southern Ocean? Q2) How much CO2 is emitted by the Southern Ocean each winter?
Response of Southern Ocean ventilation to changes in winds and response of carbon fluxes to changes in ventilation Baring Head, Scripps, and NOAA CO2, Baring Head and Arrival Heights N2O and 14CO2 GlobalView: Seasonal peak, trough, and mean over the Southern Ocean Q) What role will the Southern Ocean play in future CO2 uptake? [Le Quéré et al., Science 2007]
Shipboard O2 and CO2 measurements can greatly increase Southern Ocean data coverage R/V Lawrence M. Gould R/V Nathaniel B. Palmer R/V Tangaroa
Autonomous Inexpensive Robust CO2 Analyzer (AIRCOA) NCAR - NOAA: 0.07 ± 0.21 ppm n = 347 Regional Atmospheric Continuous CO2 Network in the Rocky Mountains (Rocky RACCOON, http://raccoon.ucar.edu)
CarbonTracker observing system simulation experiments (OSSEs) and wind field analyses 0.1 PgCyr-1 in, 0.08 out 0.1 PgCyr-1 in, 0.01 out [figures courtesy A. Jacobsen] Q1) Can New Zealand carbon fluxes be constrained from atmospheric concentration measurements? Q2) What would the optimal location be for a third continuous CO2 instrument?
HIAPER Pole-to-Pole Observations of Atmospheric Tracers HIPPO (PIs: Harvard, NCAR/NIWA, Scripps, and NOAA): A global and seasonal survey of CO2, O2, CH4, CO, N2O, H2, SF6, COS, CFCs, HCFCs, O3, H2O, and hydrocarbons NCAR Airborne O2 Instrument 5 loops over next 3 years, starting in January 2009
START-08/pre-HIPPO Campaign, April - June 2008, descent into Grand Forks, North Dakota