Presentation Q3 Report 2011
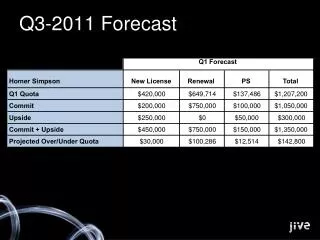
Presentation Q3 Report 2011. 1 November 2011 Johnny Alvarsson, CEO. Agenda. Highlights Q3 Business areas Group Acquisitions Financials. Net sales rose 16% Bookings increased 25% EBITA margin 12.2% Bookings and sales above SEK 2 billion

Presentation Q3 Report 2011
E N D
Presentation Transcript
PresentationQ3 Report 2011 1 November 2011 Johnny Alvarsson, CEO
Agenda • Highlights Q3 • Business areas • Group • Acquisitions • Financials
Net sales rose 16% Bookings increased 25% EBITA margin 12.2% Bookings and sales above SEK 2 billion Upturn in energy, process and marine and offshore sector Highlights Q3 + - • Low invoicing to the energy segment during the quarter
Engineering & Equipment • Net sales rose 22% • Book to Bill 0.96 • Continuous good growth in Finland deriving from a number of segments • One asset acquisition 2014-09-14 4
Flow Technology Net sales rose 12% Book to Bill 0,96 Continuous good demand from pulp & paper, chemical and other processing industry as well as water/wastewater/environment and energy One acquisition 2014-09-14 5
Industrial Components Net sales increased 8% Book to Bill 0.96 Increased demand from med-technology sector Stabilised demand on a high level for products for engineering and commercial vehicles One acquisition 2014-09-14 6
Special Products Net sales rose 20% Book to Bill 1.10 Increased demand from export industry in Sweden and Germany Improved business climate in Benelux Nice increase in energy sector Two acquisitions 2014-09-14 7
Net sales per quarter +19% +17% +16% 8
EBITA margin per quarter 8.9% 9
Order intake SEK million 2014-09-14 10
Profit share per business area (EBITA) Jan – Sep 2010 Jan – Sep 2011 11 2014-09-14
Growth analysis Indutrade Group • Net sales increase: MSEK +855 (+17%) • EBITA increase: MSEK +126 (+23%) Net sales EBITA +93 MSEK +17% +592 MSEK +12% +479 MSEK +9% +58 MSEK +11% -25 MSEK -5% -216 MSEK -4% 2014-09-14 12
Acquisitions H1, 2011 Abima Group/Indutrade Switzerland • Net sales SEK 400 million • Valves and actuators Dantherm Filtration Oy • Net sales SEK 30 million • Air filtration Mijnsbergen B.V. • Net sales SEK 60 million • Power transmission, motion control, linear systems Abelko Innovation AB • Net sales SEK 60 million • Solutions for energy measurement, remote control,building automation, energy optimization andoperational monitoring Alcatraz Interlocks BV • Net sales SEK 20 million • Interlock systems that safeguard critical installations Torell Pump AB • Net sales SEK 40 million • Pumps, compressors and equipment for cleaningsewage and waste water Hamberger Armaturen AG, Switzerland • Net sales SEK 10 million • Valves and pumps
Acquisitions 2011, August to date Enervent (assets) • Net sales SEK 17 million • Air handling systems MW-Instruments BV • Net sales SEK 10 million • Instrument service AD MediCal AB • Net sales SEK 30 million • Medical technology equipment AG Johanson Metallfabrik AB • Net sales SEK 12 million • Valves and pipe components Total net sales SEK 690 million to date
Financial targets – (average across business cycles) Annual sales growth of 10% Organic growth 9% Acquisitions 12% Currency effects -4% Total 17% EBITA-margin annually above 10% 11.4% Return on operating capital above 25% 24% Net debt equity ratio normally not above 100% 89% 17