Download
1 / 16
190 likes | 1.07k Views
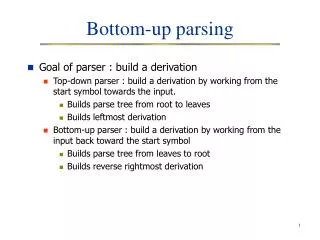
A Derivation of Bill James’ Pythagorean Won-Loss Formula. What is Sabermetrics?. The term sabermetrics, coined by noted baseball analyst Bill James, comes from the acronym for the Society for American Baseball Research, or SABR.

E N D
What is Sabermetrics? • The term sabermetrics, coined by noted baseball analyst Bill James, comes from the acronym for the Society for American Baseball Research, or SABR. • James unofficially defined sabermetrics as “the search for objective knowledge about baseball.” • Wolfram’s www.mathworld.com defines sabermetrics as “the study of baseball statistics.”
Bill James: Godfather of Sabermetrics • Bill James is a baseball historian, writer, and statistician, who was one of the first supporters/pioneers of sabermetrics and has been the most influential sabermetrician since the discipline began. • He started his work in sabermetrics in the early 1970s, and, though unpopular at the time, his work and influence have spread and many of his ideas and statistical inventions are in common use in baseball (as well as other sports) today • He is currently the Senior Operations Advisor for the Boston Red Sox, and in 2006 was named one of Time Magazine’s 100 Most Influential People
James’ Pythagorean Won-Loss Record This formula gives what a baseball team’s overall winning percentage SHOULD have been, based on the number of runs scored and runs allowed. Statistically speaking, it gives an expected value for a team’s winning percentage as a function of the team’s runs scored and runs allowed. The formula was named “Pythagorean W-L” because it reminded James of the Pythagorean theorem.
The Pythagorean formula is often used in the middle of a baseball season to estimate how a team will finish the season, or at the end of the season for a reasonable guess at next year’s W-L record. Here are a couple of interesting examples from this season: On August 4th, the 2008 Texas Rangers were 59-54 (W-L% .522), with a Pythagorean expectation of 54-59 (W-L% .478). They finished the season at 79-83 (W-L% .488). On July 20th, the 2008 Cleveland Indians were 43-54 (W-L% .443), with a Pythagorean expectation of 49-48 (W-L% .505). They finished the season at 81-81 (W-L% .500). On July 20th, the 2008 Toronto Blue Jays were 48-50 (W-L% .490), with a Pythagorean expectation of 52-46 (W-L% .531). They finished the season at 86-76 (W-L% .531). The lesson here is that a team’s luck will usually catch up with them over the course of a 162 game season. Of course, there are always exceptions: On July 20th, the 2008 Anaheim Angels were 60-38 (W-L% .612), with a Pythagorean expectation of 53-45 (W-L% .541). They finished the season at 100-62 (W-L% .617).
James’ Derivation of the Pythagorean Formula Bill James’ discovery of this formula was, by his own admission, lucky. In response to an email that I sent him asking about his methods for deriving the formula, he responded: “Mostly luck. I had been experimenting with the data and had several other good formulas for data within 1 standard deviation of the mean. However, many of them were complicated, and they returned absurd answers in extreme cases. But one day, as I was walking across campus at the University of Kansas, it hit me: it was a simple relationship of squares. This presented a much better fit to the data, and was much more elegant.”
James’ Derivation of the Pythagorean Formula James’ formula for predicting a baseball team’s winning percentage worked beautifully, despite the fact that its derivation had little basis in statistical theory. A paper published by Steven J. Miller (then an Associate Professor of Mathematics at Brown University) showed that, under reasonable statistical assumptions about a baseball team’s runs scored and runs allowed, James’ Pythagorean Formula can be shown to follow mathematically.
Assumptions • Runs scored and runs allowed can be approximated by continuous random variables • “In order to obtain a simple closed form for expressions for the probability of scoring more runs than allowing in a game, we assume that the runs scored and runs allowed are drawn from continuous and not discrete distributions. This allows us to replace discrete sums with continuous integrals . . . Of course assumptions of continuous run distribution cannot be correct in baseball, but the hope is that such a computationally useful assumption is a reasonable approximation to reality.” • Runs scored and runs allowed can be modeled by continuous Weibull distributions • “[The Weibull’s flexible shape parameters] make it much easier to fit the observed baseball data with a Weibull distribution than with some of the better known distributions. Further, the exponential decays too slowly to be realistic; it leads to too many games with large scores. By choosing our parameters appropriately, a Weibull has a much more realistic decay . . .” • Runs scored and runs allowed are statistically independent • “In a baseball game, runs scored and runs allowed cannot be entirely independent, as games do not end in ties . . . Modified chi-squared tests do show that, given that runs scored and runs allowed must be distinct integers, the runs scored and runs allowed per game are statistically independent.”
The Joint PDF Since a team’s winning percentage is the probability that they will score more runs than they allow, we want to find P(X>Y), where X is runs scored and Y is runs allowed. Since this probability depends jointly on X and Y, we use a joint probability density function: