Download
1 / 24
240 likes | 422 Views
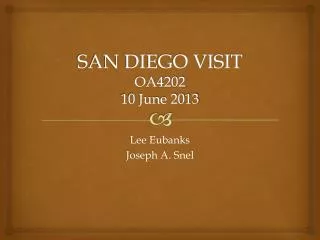
SAN DIEGO VISIT OA4202 10 June 2013. Lee Eubanks Joseph A. Snel. Outline. Intro/Backstory Problem Assumptions Graph Elements Questions Formulation Results Relativity Follow-Up. Intro/Backstory. One Day Vacation to San Diego Maximize events/restaurant visited within 960 min

E N D
SAN DIEGO VISITOA420210 June 2013 Lee Eubanks Joseph A. Snel
Outline • Intro/Backstory • Problem • Assumptions • Graph Elements • Questions • Formulation • Results • Relativity • Follow-Up
Intro/Backstory • One Day Vacation to San Diego • Maximize events/restaurant visited within 960 min • The sites are within the specific San Diego location • Include events/restaurants that are possible locations we want to see • There are 2 sites and 1 restaurant we have to visit
Problem • Need to create a Networks model maximizing number of nodes within 960 minutes (16 hrs) • A shortest path problem with interdiction • Take the shortest path from each node to reduce time spent driving • Hotel will be the Start/End Node • There are a few locations we must visit
Assumptions • All activities must be completed in 960 minutes • Because San Diego is a heavy populated area, there are numerous routes the nodes selected, however, these routes (edges) would only significantly increase travel time, therefore ignore these routes as if they did not exist. • Traffic times are constant throughout the day • Interdictions in our case will be caused by Road Construction closing the roads, or Traffic Jams significantly increasing the cost (time) on the edge. • Must-Go-Sites seen not in consecutive order
Edges • Are established ground LOC’s • Can be attacked • CVS file defines all possible edges • Each event has edge to all other possible events/restaurants • Each restaurant has an edge to all other events only
Intra-Node • Had problems initially • Program was ending well before 960 min • Sea World trip takes up 240 min by itself • Needed to account for time spent at nodes • Split each node into Start – End nodes • Can attack edge between Intra-Node
Sample Path E S E E S S
Questions to Answer • How many nodes can we visit within certain time frame before the program takes us back to the hotel? • How long does it take to transit the route predicted by the model? • What impact interdiction have on the model?
Results • From our program the best track would be: • Navy Lodge -> USS Midway USS Midway-> Greek Island Café Greek Island Café -> Sea World Sea World-> Mission Bay Park Mission Bay Park-> The Fields Pub The Fields Pub-> Navy Lodge Total Time = 738 mins Enough time to relax at the beach back at the hotel!!!
Interdiction (Cont) • First Interdiction: • One Interdiction on the primary road from Sea World to Mission Bay Park only adds a few minutes to the drive, but it does not take it out of the daily activity’s. • Directions change from taking Sea World Drive to I-5 then north to Mission Bay Park • Now must take Ocean Beach Freeway to I-5, then north to Mission Bay Park
Interdiction (Cont) • Second Interdiction: • Now we have two interdictions on the primary road from Sea World to Mission Bay Park and on I-5. • This forces us to use back roads to reach Mission Bay Park, adding a significant increase in time, causing the model to choose a different location.
Results w/Interdiction • With the two interdictions taking out time saving routes to Mission Bay Park, our program decides the next possible route to include Miramar Marine Corps Air Station. Total time for route is now 757 minutes. Navy Lodge-> USS Midway USS Midway->Greek Islands Café Greek Islands Cafe->Sea World Sea World ->Miramar MCAS Miramar MCAS->The Fields Pub The Fields Pub->Navy Lodge
Operators Resilience Curve * Note: the nodes change yet the number remains the same.
Relativity • New Commander’s Inspection Tour • VIP Visit • Re-Route Troop/Ship/Supply Movement • Disaster Relief
Summary/Follow-up • Need to create a Networks model max visitation within 960 minutes (16 hrs) • Follow-on Considerations • Add Cost to Node • Add Cost to Edge • Add Commodity to Move • Adjust Constraints
References • http://www.sdmts.com/trolley/trolley.asp • http://www.sdchamber.org/ • http://www.sandiego.org/ • https://maps.google.com/maps?hl=en&tab=wl