Download
1 / 5
50 likes | 167 Views
ZoomCharts is offering data visualization tools to support speakers at An Event Apart San Diego, taking place June 8th through 10th, 2015 at San Diego Marriott Marquis & Marina, 333 W Harbor Drive, San Diego, CA 92101. Check out what you can do with ZoomCharts charts and graphs at http://zoomcharts.com ZoomCharts is the world’s most interactive data visualization software, with charts and graphs that are 100% interactive, support big data, work with all mobile devices, and perform at incredibly fast speeds. Be among the growing number of professionals discovering the exciting potential that ZoomCharts has in bringing data presentation to the next level. An Event Apart is a must attend web design conference for people who make websites. It provides a great learning environment for those who are passionate about web design and web design standards, and covers topics in coding, content, usability, and design. The event is highly attended by web professionals, including designers, developers, IAs, UX pros, project managers, writers, editors, marketers, and even clients. Speakers include Jeffrey Zeldman, Co-Founder of An Event Apart, and publisher of A List Apart and A Book Apart; Sarah Parmenter, Founder, You Know Who; Tim Brown, Type Manager, Adobe Typekit; Atomic Design’s Brad Frost; Jason Grigsby, Co-Founder, Cloud Four; Josh Clark, Principal, Global Moxie; Dan Mall, Founder & Design Director, SuperFriendly; Nicole Sullivan, Founder, Stubbornella; designer Jen Simmons; CSS expert Chris Coyier; Information Designer Kevin M. Hoffman; and Mike Monteiro, Design Director, Mule Design. ZoomCharts http://www.zoomcharts.com The world’s most interactive data visualization software

E N D
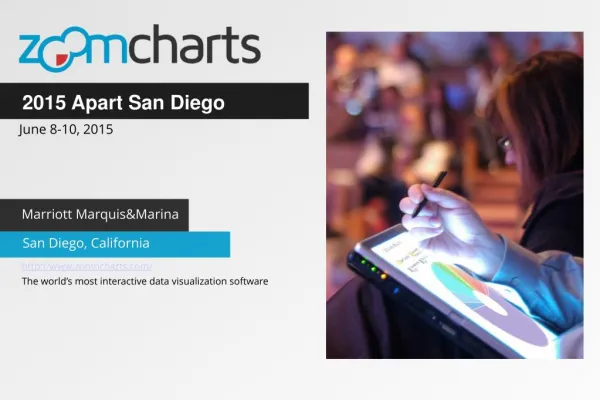
2015 Apart San Diego June 8-10, 2015 Marriott Marquis&Marina San Diego, California http://www.zoomcharts.com/ The world’s most interactive data visualization software
2015 Apart San Diego June 8-10, 2015 ZoomCharts is offering data visualization tools to support speakers at An Event Apart San Diego, taking place June 8th through 10th, 2015 at San Diego Marriott Marquis & Marina, 333 W Harbor Drive, San Diego, CA 92101. Check out what you can do with ZoomCharts charts and graphs at http://zoomcharts.com ZoomCharts is the world’s most interactive data visualization software, with charts and graphs that are 100% interactive, support big data, work with all mobile devices, and perform at incredibly fast speeds. Be among the growing number of professionals discovering the exciting potential that ZoomCharts has in bringing data presentation to the next level.
2015 Apart San Diego June 8-10, 2015 An Event Apart is a must attend web design conference for people who make websites. It provides a great learning environment for those who are passionate about web design and web design standards, and covers topics in coding, content, usability, and design. The event is highly attended by web professionals, including designers, developers, IAs, UX pros, project managers, writers, editors, marketers, and even clients. Speakers include Jeffrey Zeldman, Co-Founder of An Event Apart, and publisher of A List Apart and A Book Apart; Sarah Parmenter, Founder, You Know Who; Tim Brown, Type Manager, Adobe Typekit; Atomic Design’s Brad Frost; Jason Grigsby, Co-Founder, Cloud Four; Josh Clark, Principal, Global Moxie; Dan Mall, Founder & Design Director, SuperFriendly; Nicole Sullivan, Founder, Stubbornella; designer Jen Simmons; CSS expert Chris Coyier; Information Designer Kevin M. Hoffman; and Mike Monteiro, Design Director, Mule Design.
2015 Apart San Diego June 8-10, 2015
Check out ZoomCharts products: Network Chart Big network exploration Explore linked data sets. Highlight relevant data with dynamic filters and visual styles. Incremental data loading. Exploration with focus nodes. Time Chart Time navigation and exploration tool Browse activity logs, select time ranges. Multiple data series and value axes. Switch between time units. Pie Chart Amazingly intuitive hierarchical data exploration Get quick overview of your data and drill down when necessary. All in a single easy to use chart. Facet Chart Scrollable bar chart with drill-down Compare values side by side and provide easy access to the long tail. ZoomCharts http://www.zoomcharts.com/ The world’s most interactive data visualization software