Download
1 / 18
180 likes | 314 Views
Global Population Change (Lesson 5). Learning Objectives. To recall the Demographic Transition Model To predict the future of global population To assess the value of the Demographic Transition Model. The Demographic Transition Model.

E N D
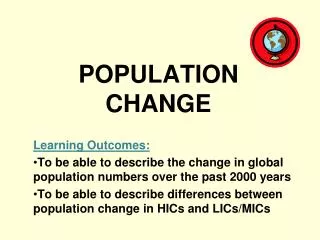
Learning Objectives • To recall the Demographic Transition Model • To predict the future of global population • To assess the value of the Demographic Transition Model
Match these countries to a stage of the DTM and explain why they’re there
In Italy, why are they demolishing primary schools to build cemeteries?
Why was that task difficult? What further information did you need? Could the same thinking/logic be applied to all countries to place them on the model?
Warren Thompson was an American demographer (he studied population change) and in 1929, he came up with a theory of ‘demographic transition’ and developed a model based on his research. Like Malthus before him and Boserup since, he argued that population, resources and development were all linked together and that, like Malthus, population growth can cause problems. Thompson categorised all countries in the world into three types of country...
Was Thompson right to categorise like this? What has happened since...?
The DTM is not perfect and has many limitations to it. It is fairly accurate in that it provides a general overview of stages that a country can expect to pass through as it develops and also can give a snapshot of where different countries are in terms of demographics and development at any one time. However, the limitations are numerous... Here are some...: Thompson based the DTM on European and North American populations and then applied them to all countries. Countries do not have ‘uniform’ populations. For example, there are big differences within countries. Such as between rural and urban populations (BR lower in urban areas than rural); between high and low income groups (higher LE for professionals (85) than for unskilled manual workers (78). Can you think of any more differences...?
Have a look at the cards you have been given. They all show either strengths or weaknesses of the DTM as a model to predict the populations of different countries. Sort them into two; one showing strengths and one showing weaknesses. You have 10 minutes. Now, further categorise them into social, political, economic and environmental.
Discussion (or homework) ‘There should be a sixth stage to the Demographic Transition Model’. To what extent do you think this is true? What characteristics would the stage show? Does this prove that the DTM is a weak theory?
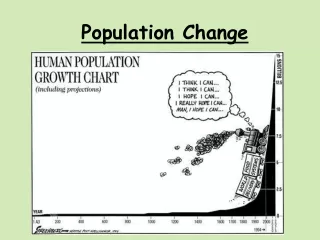
The Demographic Transition Model was originally a four stage model, as the BR, DR and total population could be easily separated into four different time periods. However, some developed countries are now entering a fifth stage of the DTM. This is where the BR actually drops below the DR and so the total population begins to steady itself and then fall. This is happening in countries such as Germany, Italy and Sweden. Why? But...
... some countries in southern Africa have also recently seen their birth rate fall below their death rate. Why is this? And does that mean that they are also in stage 5?
Have a look at the cards you have been given. They all show either strengths or weaknesses of the DTM as a model to predict the populations of different countries. Sort them into two; one showing strengths and one showing weaknesses. You have 10 minutes. Discuss your answers with the class.