Download
1 / 33
330 likes | 537 Views
Explore how population distribution changes through natural processes and migration. Learn about birth rates, death rates, and the demographic transition model. Engage in interactive activities and discussions to understand the factors influencing population growth.

E N D
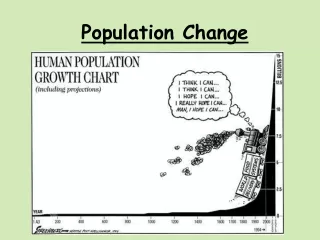
Population change How and why does the distribution of population change overtime?
Connector • Open your books to your homelearning • Swap books • Mark each others work out of 4 marks • How are the two graphs you collected different or similar form each other?
By the end of the lesson: • By the end of the lesson we will have: • All pupils will have written a definition of the key term terms • All pupils will have understood and annotated a DTM • All pupils will have completed a living graph
Homelearning Draw two separate spider diagrams . For both birth rate and death rate, write down the causes/factors for an increase and decrease of both. Reasons for increase and decrease in birth rates Increase of births due to a lack of contraception
No matter where you are in the world, population change (growth and decline) is produced by 2 processes Natural change and Migration We will be concentrating on natural change
What do the following terms mean? Birth rate Death rate
Birth rate • What does it mean? • The birth rate is number of babies born per thousand people.
Death rate • What is the death rate? • The death rate is the number of people who die per thousand people.
Natural population What is natural population? It is the difference between birth rate and death rate. It does not include migration (movement of people)
Natural Population increase • The natural increase is birth rate minus the death rate. • If the birth rate was 15 and the death rate was 3, what would the Natural Increase be? • Birth rate = 12; Death rate = 12: NI = ? • Birth rate = 8; Death rate = 9: NI = ? • So why would a population decrease?
Look at the following sheet Complete task one individually With the person sitting next to you; compare your ticks.
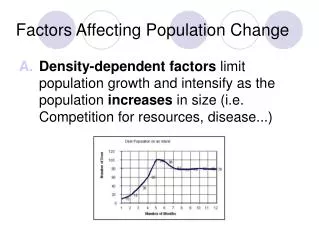
The development of a country influences it population growth • It has been observed that countries develop and, as a result, so too does the rate of natural change. • Theses changes underlie a generalisation known as the ‘demographic transition model’. It suggests that countries pass through 5 different phases.
On a the outline the graph Copy the BR, DR and population. Use three different colours and create a key to start with. For each stage of the transition model can you explain why population is changing For each stage; write down country that might be in this stage.
Why are the birth and death rates fluctuating? Birth rate Death rate Population
Cut out the statements In groups of 3 or 4 decide where the best place for each statement is. You will be expected to justify your choice using the key terminology in your explanation • Birth rate • Death rate • Population change • Natural increase/decrease
But before you start look at the following statement Jack has realised that there is not enough farmland in his home village for everyone to grow the food they need. He wants to leave and take his wife and 5 children to another country where there are fewer people and more land available for farming.
Explanation This is because of changes in the (Birth Rate / Death Rate / Total Population ) so will happen at stage (A, B, C, D ). There is now not enough farmland for all the people in the village because the (Birth Rate / Death Rate / Total Population ) is now much (higher / lower), so there are too many/ few people living in the area now.
You now need to choose 2 statements and explain where they should go.
Activity – card sort • In pairs, separate the cards into 4 piles, one for each stage. • Copy them into your books underneath the correct stage of the Demographic Transition Model • Decide which stage the general description is referring to and put it in the correct column.
Activity – card sort • In pairs, separate the cards into 4 piles, one for each stage. • Copy them into your books underneath the correct stage of the Demographic Transition Model • Decide which stage the general description is referring to and put it in the correct column.
Task • Select two countries (1 MEDC and 1 LEDC) from your data table (from last lesson) which have not been mentioned today. • Describe and explain what stage they are in.
Model answer - SEE STATEMENT The UK is in stage 4 of the Demographic Transition Model. It has both a low death rate of 9 and a steady birth rate of 13 which makes the rate of natural increase small, at only 0.3% EXPLAINATION The low death rate is due to good heath care and good quality of life. There is no need for large families and infant mortality is low, so the birth rate is relatively low. ELABORATION This means the population growth is quite small and steady, although it can fluctuate because of wars or pandemics.
Review – Quick-fire Quiz • How many stages are there in the DTM? • What are the three lines on a DTM? • Which stages are the following countries currently in: Cuba, Sri Lanka, China, UK, Ethiopia? • Why are there problems with the DTM?
Stage 1 • Britain and Europe were like this before 1750 (before industrialization), and some parts of the poorest countries are at this stage now.
Stage 2 • Britain was in this stage towards the end of the19th century, and countries like Sri Lanka have these characteristics today.
Stage 3 • Britain was like this in the first half of the 20th century, and developing countries like China and Cuba are in this position today.
Stage 4 • Much of Europe was in this stage after 1940, along with Japan, the USA and, now, other developed countries.