Download
1 / 25
260 likes | 466 Views
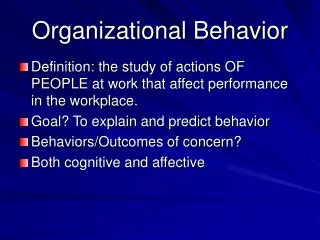
OB Outcomes: Attitudes and Behaviors Effort Job Satisfaction Absenteeism Turnover Stress Workplace Violence Organizational Citizenship Behavior and Commitment Employee Theft Safety and Accidents Sexual Harassment Grievances. Influenced by Managers Using

E N D
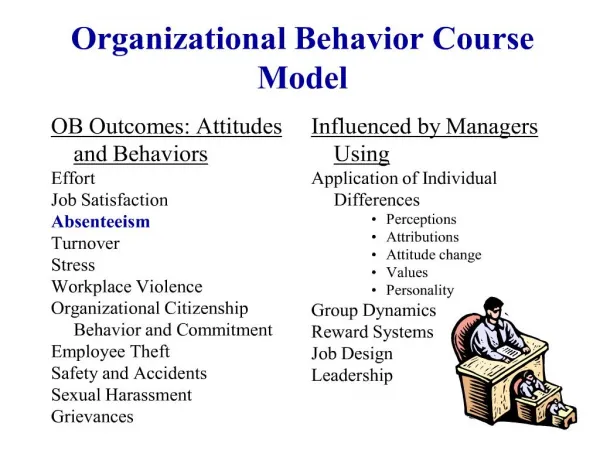
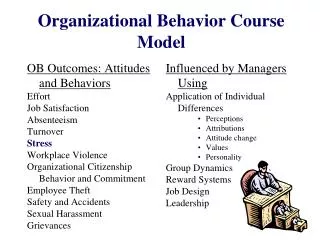
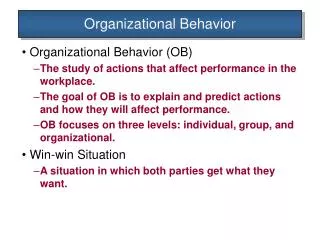
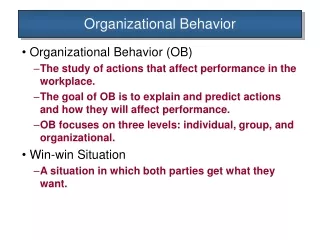
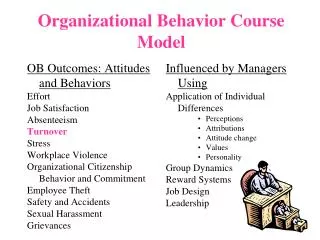
OB Outcomes: Attitudesand Behaviors Effort Job Satisfaction Absenteeism Turnover Stress Workplace Violence Organizational Citizenship Behavior and Commitment Employee Theft Safety and Accidents Sexual Harassment Grievances Influenced by Managers Using Application of Individual Differences Perceptions Attributions Attitude change Values Personality Group Dynamics Reward Systems Job Design Leadership Organizational Behavior Course Model
Motivations to Manage Turnover • 1. Economic Trends • Directly related to economic conditions • ∙ Unemployment rate Sept. 2012: Nation 7.8% Iowa 5.2% • ∙ Unemployment rate Aug. 2007: Nation 4.6% Iowa 3.6% • Turnover high when unemployment is low • Turnover low during poor economic times • 2. Demographic Trends • Retirement patterns • Low number of workforce entrants • Next generation may prefer to work • fewer hours • 3. Changing Employment Patterns • ∙ Shorter job tenures • Ages 18 to 32: 8.6 jobs • Overall, employees changing jobs every 4 years
Motivations to Manage Turnover • 4. Normal Turnover? • ● Need industry specific data: BLS, Fortune magazine, CompData Surveys • Some industries (manufacturing) are lower: 7.6%/year • Some are higher (hospitality): 23.4% • Better companies have lower rates; average is 15% • ● Let’s look at turnover and voluntary turnover by industry and over time • ● Fortune Magazine’s 100 Best Companies • ● Company rate or level may not be ideal anyway (AZ • Council)
Turnover Rates by Industry http://compforce.typepad.com/. Based on 34,000 organizations across the U.S.
Fortune’s 100 Best Firms Demonstrate Low Voluntary Turnover--Updated Fortune 2-13
Turnover Rates: Mental Health Jobs Human Resource Assistant Secretary Maintenance Worker Driver Therapist Cook Case Manager Teachers Behavioral Health Technician Teachers Aide Supervisor Clinical Director Accountant HR Manager Controller Executive Director Annual Turnover Rates
Motivations to Manage Turnover • 5. Need to Consider Customer Satisfaction • Sears also linked T/O to customer satisfaction • ▲Stores w/high customer sat: 54% turnover • ▲Stores w/low customer satisfaction: 83% turnover • 6. Need to Manage Turnover to Retain Best Employees & Minimize Costs • ▪ Who is quitting? ▪ What are the replacement costs?
TURNOVER COSTS Based on Entry Level Salary of $48,463* *Entry level salary of Fortune 500 employee (2013 figures)
Percent of Standard Proficiency Attained Employment Duration (Days) Hypothetical Learning Curve for New Hires
TURNOVER COST EXAMPLES BY COMPANY AND POSITION Cost $25,000 $ 8,000$ 3,637 $ 79,672 $ 32,160$ 34,365 $ 5,688 $ 11,609 $ 20,765$ 1,204 Company State govt, (LA) Call center Retail Insurance Software Hospitality Fast-food chain Position Protective services (police, wildlife & fisheries, guards) Call center employeeSupermarket cashier Manager Project LeaderSystems engineer Hotel front desk-Miami Hotel front desk-NY Store ManagerCounter Person Source: Kepner & Tregoe, Jan. 1999 (Saratoga Institute Turnover Costing Model), SASHA Corp 2011
Forms of Turnover • Nonvoluntary: Employer controlled (layoffs, terminations, downsizing) • Voluntary: Employee controlled (quits, retirements) • Gray Area: (spouse relocation, child/elder care issue, performance problem)
CAUSES OF TURNOVER IN NURSING SAMPLE Reasons Unknown Personal Reasons Death Retirement Poor Health Temporary Position Completed Prescribed Service or Course Geographic Factors:Job Too Far, Leaving City Family Illness or Home Duties To Stay Home To Attend School Pregnancy Marriage Enter Military Service Unsatisfactory Work Hours Work Too Difficult; Misunderstanding of Duties General Job Dissatisfaction Present Wages Inadequate Other Employment
Analyzing Forms of Turnover Among Nurses from A Managerial Perspective
Turnover Measures 1. Separation Rate # of employees who left during period = avg. # of employees during period X 100 a. Jan. 1 - 20 employees 7 quit and are replaced, 2 new hires Jan 31 - 22 employees 7/(20 + 22)/2 = 7/21 = 1/3 = .33 .33 x 100 = 33% b. Growth scenario Feb. 1 - 22 employees 16 new hires, 7 quit & are replaced Feb. 28 - 38 employees 7/(22 + 38)/2 = 7/30 = .23 or 23%
Turnover Measures (Continued) II. Instability Rate # of initial employees who leave during a period = # of initial employees X 100 a. Jan.: 7/20 = .35 or 35% b. Feb.: 7/22 = .32 or 32% III. Wastage Rate # of new employees who leave during a period = # of new members X 100 a. Between Feb. 1 & 28, 8 new hires quit: 8/16 = .50 or 50% IV. Avg. Length of Service = Sum of length of service for each employee # of members
Commitment Influences: • Procedural Justice • Attraction of Internal Roles • Job Security • Job Investments • Extra Organizational Conflicts • Conditions of Job Entry • Commitment Propensity • Satisfaction Influences: • Job Complexity • Role Stress • Group Cohesion • Compensation • Leader-Member Relations • Met Expectations • Negative Affectivity Organiza-tional Commitment Job Satisfaction Shocks • Labor Market: • Unemployment • Knowledge of Other Jobs • Relocation Costs Decisions to Quit Job-Seeking Costs & Benefits: Turnover Costs & Benefits Job Search Evaluate Alternatives Resignation Hom-Griffeth Model of Turnover
Predictors of Voluntary Turnover • Age Turnover • (around ρ = -.14) • Length of service • ↑ Length → ↓ T/O; but why? • Sex & family size • Men & women quit at similar rates • ↑ # of dependents → ↓ T/O • Pre-employment predictors: • ▪ ↑prior turnover behavior → ↑ T/O • ▪ ↑time (months) on prior job →↓ T/O • ▪ ↑ employee referral →↓ T/O • ▪ ↑# friends/family present in org. → ↓ T/O • ▪ ↑ “overt” intent to stay (ask ‘em!) → ↓ T/O • ▪ ↑desire for the job (ask ‘em!) → ↓ T/O
Predictors of Voluntary Turnover • Personality • ▪ ↑Conscientiousness (& decisiveness) → ↓ T/O • ▪ ↑Emotional stability → ↓ T/O • ▪ ↑Agreeableness → ↓ T/O • ▪ ↑Openness to new experience → ↑ T/O • ▪ ↑Self-confidence → ↓ T/O • Union presence • Attitudes (job satisfaction, organizational commitment) • Pre-employment interventions: RJPs
Sewing Machine Operators West Point Cadets Telephone Operators Insurance Agents Bank Tellers U.S. Marines Nurses Providing Job Candidates With Accurate and Complete Information About the New Job Reduces Turnover
Predictors of Voluntary Turnover • 9. Work group size • 10. Job enrichment • 11. Task repetitiveness • 12. Considerate leadership • 13. Stress • 14. Perceived job availability • Withdrawal behaviors: Lateness (very weak) and absenteeism (moderate, ↑ abs → ↑ T/O ) • Job performance (low performers quit more than high performers but low & high performers quit more than avg. performers)
POSSIBLE POSITIVE CONSEQUENCES OF TURNOVER 1. Displacement of poor performers 2. Increased satisfaction among stayers 3. Infusion of new knowledge/technology via replacements 4. Facilitate organizational change 5. Increased internal mobility opportunities 6. Decrease in other “withdrawal” behaviors 7. Opportunities for cost reduction
PRACTICAL STRATEGIES FOR • MANAGING TURNOVER • Hire more carefully • Use pre-employment interventions (see example) • 3. Promote job satisfaction • 4. Promote job autonomy through job enrichment • 5. Use small work groups • 6. Reduce task repetitiveness • 7. Improve human relations skills of supervisors • 8. Reduce stress (e.g., casual dress code) • 9. Promote organizational commitment (e.g., career counseling; • side bets) • 10. Emphasize person/job fit • 11. Address non-work sources of turnover (e.g., EAPs)
Demonstrating Cost Savings of RJP Retention Strategy Practical Application of a Control Group Evaluation