5.7 SCATTER PLOTS AND TREND LINES:
220 likes | 679 Views
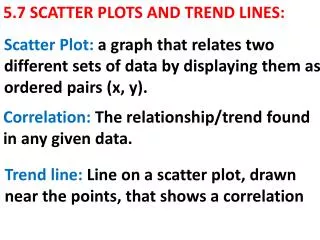
Scatter Plot: a graph that relates two different sets of data by displaying them as ordered pairs (x, y). . 5.7 SCATTER PLOTS AND TREND LINES:. Correlation: The relationship/trend found in any given data. . Trend line: Line on a scatter plot, drawn near the points, that shows a correlation.

5.7 SCATTER PLOTS AND TREND LINES:
E N D
Presentation Transcript
Scatter Plot: a graph that relates two different sets of data by displaying them as ordered pairs (x, y). 5.7 SCATTER PLOTS AND TREND LINES: Correlation: The relationship/trend found in any given data. Trend line: Line on a scatter plot, drawn near the points, that shows a correlation
Interpolation: The act of estimating a value between two known values. Extrapolation: The act of predicting a value outside of the range of known values. Line of Best Fit: Line that shows the most accurate relationship between two sets of data.
Correlation Coefficient(r): a number from -1 to 1 that tells us how closely the equation models the data. Causation: A change in one quantity causes a change in a second quantity.
SCATTER PLOTS: We must be able to provide domain, range and ordered pairs.
CORRELATIONS: In any data we can have three types of correlation: y Positive Correlation: x Our data increases from left to right.
Negative Correlation: y x Our data decreases from left to right.
No Correlation: y x Our data does not have any pattern.
Whenever we are given data/information/ordered pairs, we must be able to provide certain details: Ex: Make a scatter plot of the data, provide the type of relationship it represents and the approximate weight of a 7-month-old panda. Weight of a Panda
To answer the questions on the panda task we must do three procedures: Procedure 1: Create a Scatter Plot Procedure 2: Write an Equation of the Trend of the Line Procedure 3: Estimate the weight of a 7-month-old panda.
Procedure 1: Scatter Plot Positive Correlation Trend Line 60 50 40 Weight (lbs) 30 20 10 4 6 8 10 2 12 Age (Months)
Procedure 2: Write an equation of the Trend Using A(4, 17.1) and B(8, 37.9), points on the positive correlation line, we find the slope m= = = 5.2 Using one of the two points and the point-slope form equation: - = m(-) we get: -17.1 =5.2(- 4) -17.1 =5.2– 20.8 =5.2– 20.8 +17.1 =5.2– 3.7
Procedure 3: Estimate the weight of the 7-month-old panda Using the found equation of the Trend Line: =5.2– 3.7 and letting x = 7 months, we get: =5.2(7)– 3.7 =32.7 =36.4– 3.7 Thus a 7-month-old panda will weight about 32.7 lbs.
YOU TRY IT: Use the data below to create a scatter plot, provide the relationship and approximate the daily temperature in January at a latitude of 50o N.
Procedure 1: Scatter Plot 80 70 60 50 40 Temperature (o F) 30 20 10 Negative Correlation Trend Line 20 25 30 35 40 45 50 Latitude (o N)
Procedure 2: Write an equation of the Trend Using A(30, 67) and B(40, 37), points on the negative correlation line, we find the slope m= = = - 3 Using one of the two points and the point-slope form equation: - = m(-) we get: -67 =-3 (- 30) - =-3 =-3 + 90 + 67 = -3157
Procedure 3: Estimate the temperatureof the 50oN: Using the found equation of the Trend Line: = -3157 and letting x = 50oNof latitude we get: =-3(50) =7 = –150 + 157 Thus at latitude of 50o N the temperature will be about 7o F.
CLASSWORK:Page 338-339 Problems: 11, 20, 21