Download
1 / 11
110 likes | 276 Views
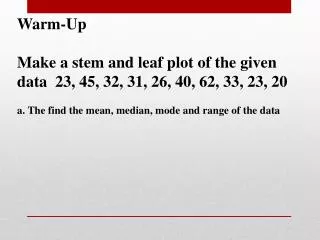
Warm-Up Make a stem and leaf plot of the given data 23, 45, 32, 31, 26, 40, 62, 33 , 23, 20 a. The find the mean, median, mode and range of the data. 13.8 Box and Whisker Plots. A box and whisker plot organizes data into 4 groups and plots it on a number line.

E N D
Warm-Up Make a stem and leaf plot of the given data 23, 45, 32, 31, 26, 40, 62, 33, 23, 20 a. The find the mean, median, mode and range of the data
A box and whisker plot organizes data into 4 groups and plots it on a number line. *Need to know the lowest value, highest value, lower quartile, upper quartile, and the median
Median – The middle number of a set of data. • Upper Quartile (3rdQuartile) – The median of the upper (right) half of the data • Lower Quartile (1stQuartile) – The median of the lower (left) half of the data • Upper/Lower Extreme – The highest and lowest numbers in a set of data. Box-and-Whisker Plot Vocabulary
Then lengths of songs (in seconds) on a CD are listed below. Make a box-and-whisker plot of the song lengths. 173, 206, 179, 257, 198, 251, 246, 295, 181, 261
Make a box-and-whisker plot of the ages of eight family members: 60, 15, 25, 20, 55, 70, 40, 30, 52
A box-and-whisker plot separates data into four groups: *the 2 parts of the box *the 2 whiskers Each part has approximately the same number of data values. interquartile range: the range between the lower quartile and upper quartile (size of the box)
The box-and-whisker plots below show the normal precipitation (in inches) each month in Dallas and in Houston, Texas. For how many months is Houston’s precipitation less than 3.5 inches? Compare the precipitation in Dallas with the precipitation in Houston.
outlier: a value that is widely separated from the rest of the data values (either way too high, or way too low) How do you think an outlier might affect the data? The measures of central tendency? The range?
Assignment: pg. 889 #3 – 17 odd