Taking the Pedestal Data
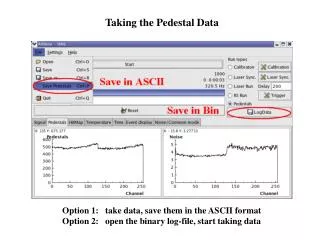
Taking the Pedestal Data. Option 1: take data, save them in the ASCII format Option 2: open the binary log-file, start taking data. Offline Analysis with SinPreguntas.C. The root macro “SinPreguntas.C” requires pedestals in the ASCII format. If the

Taking the Pedestal Data
E N D
Presentation Transcript
Taking the Pedestal Data Option 1: take data, save them in the ASCII format Option 2: open the binary log-file, start taking data
Offline Analysis with SinPreguntas.C The root macro “SinPreguntas.C” requires pedestals in the ASCII format. If the program fails to read pedestals, it will calculate them from the dataset. Amplitudes after the pedestal subtraction are compared for two cases: reading pedestals from the ASCII file and their online calculation. In the second case small charges from irradiated detectors are being measured more accurately than signals from fresh sensors (denominator in the CCE) whose pedestal calculation is affected by high and frequent amplitudes. The worse case is shown where each event has a signal.
External vs. Internal Calibration Pulses External calibration: ADC units (right plot) were calculated as a difference between two calibration lines (left plot) obtained with 2 pF and 1 pF injection capacitors to exclude parasitic influence of the PCB. Internal calibration: for details see pp.72 and 138 of Sven Loechner’s PhD Thesis
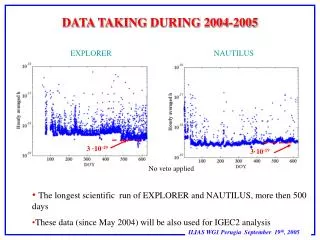
External Calibration vs. Charge Collection Charge collection measurement for 140 um and 300 um sensor thicknesses (left plot) compared to calibration with external test pulses (right plot). The most probable values of charge are taken 11000 electrons for 140 um and 24000 electrons for 300 um thin detectors (Particle Data Group, p. 290) Conclusion: “german” electrons are true electrons !
Gain as a function of detector capacitance Gain of the Beetle chip reduces with capacitance at the input of the charge- sensitive amplifier. This dependence is particularly strong at small capacitor values in the range 1..3 pF typical for the miniature strip detectors (for details see p. 14 of the Beetle Reference Manual). It is rather difficult to quantify this effect with calibration pulses due to the charge division between injection and load capacitors. The charge collection measurement with different bias voltages is also ineffective because of reduced amplitudes from partially-depleted detectors. Variation of gain gives rise to systematic uncertainty of charge that however cancels out to the first order approximation in the CCE measurements: Fresh detectors: all charge collection measurements are made for fully-depleted detectors with stable capacitance Irradiated detectors: capacitance of heavily-irradiated detectors shows very weak dependence on the bias voltage
Gain variation with Temperature Gain of the Beetle chip increases by factor 1.2 at -20C compared to the room temperature (for details see p. 125 of Sven Loechner’s PhD Thesis). Saturation of the Beetle Output Charge collection measurement for 300 um thin non-irradiated sensor with “KAZU” settings: ADC overflow for the tail of the Landau spectrum (amplitudes are shown for the cluster seed only). MPV could be (reliably ?) calculated => “KAZU” settings are just OK (no headroom at all).
Good Practices All measurements of fresh and irradiated samples have to be held at the same temperature (= in the freezer). Pedestals must be saved in the ASCII format to be used with “SinPreguntas” offline analysis. Binary (raw) data logging is recommended for the future use. Measures to obtain clean Landau Spectrum The new diecast lid provides beta source position close to the DUT. 1mm plastic absorber between DUT and scintillation trigger removes low- energy component of beta spectrum. Relatively high trigger threshold (200mV, default in “KAZU”) reduces the low-energy component further. The trigger rate is 150..200 Hz with 563 or 557 Sr-90 sources (both 370 MBq) at -20C.
Priceless Experience View of 140 um thin strip detector (irradiated by 24 GeV protons to 3e+15 neq) after its breakdown at 1300V. The bias current at 1200V was 100 uA at -24C. ISEG current limit was set to 1mA. The charge collected at 1200V was ~11000 electrons. Breakdown field strength of silicon is 300 kV/cm -> 4.2 kV for 140 um thin detector