Download
1 / 43
430 likes | 484 Views
Reflect on guiding students in developing statistical questions. Explore categorical and measurement data progression. Discuss success, challenges, and learnings from the process. Address differences in classroom practice, standards of mathematical practice, and considerations for teachers. Engage in hands-on activities to enhance understanding. Compare and discuss unique units of measurement with historical contexts. Enjoy fun trivia to test your knowledge!

E N D
Taking the correct data path! Math AllianceFebruary 21
Reflecting on the process of helping students develop a statistical question • Number Off 1-5 • Letter off within your group (A, B, C, D) • Share a success you had in helping your students develop a statistical question. • Share a challenge you had in helping your students develop a statistical question. • Share something you learned about the student you focused on in your videotape.
Reflecting on the process of helping students develop a statistical question • If you were to do this again, how would you make changes to the project?
Learning Intention Success Criteria We are learning to…understanding the development of the data and measurement strand and how it supports the study of statistics in grades 6, 7, and 8. We will be successful when…we can articulate the difference between categorical data and measurement data, and understand connections to the middle school statistics standards.
Measurement and Data Progressions: K-3 Categorical and 2-5 Measurement Data The first sentence of the progressions states: As students work with data in K-5, they build foundations for their study of statistics and probability in Grades 6 and beyond and they strengthen and apply what they are learning in arithmetic. • What message are the authors sending to teachers K-5? Progressions: K-3, Categorical Data; Grades 2-5 Measurement Data
Two data paths: Categorical and Measurement In your table group you will study Categorical Data Use information from the progressions reading to identify: • A clear definition of the area you selected. • Specific shifts in rigor at each grade level. • Connections to other areas of mathematics. • Provide examples • Be prepared to share out your findings.
Two data paths: Categorical and Measurement In your table group you will study Measurement Data Use information from the progressions reading to identify: • A clear definition of the area you selected. • Specific shifts in rigor at each grade level. • Connections to other areas of mathematics. • Provide examples • Be prepared to share out your findings.
Sharing Learning: Categorical and Measurement • As a group: • In what way, will these standards support the ideas developed in grades 6, 7, and 8? • What connections can you make to the article you read? Franklin, C., Mewborn. D. Statistics in the Elementary Grades: Exploring Distributions of Data, Teaching Children Mathematics, August 2008.
Talking About the Reading:Categorical and Measurement Data • Compare this information with current practice in classrooms, in what way are these standards different than what we are used to teaching? • What Standards of Mathematical Practice will be at play when engaging students in this work? • What will teachers need to consider before beginning?
Measurement Data • For the next 25 minutes you will be working with the standard from Measurement Data strand. • You will be: • Working with a partner to complete a full data process. • Creating a question. • Gathering data • Representing data results • Summarizing your data-asking questions.
Measurement Data3.MD. 4 3.MD.4 Generate measurement data by measuring lengths using rulers marked with halves and fourths of an inch. Show the data by marking a line plot, where the horizontal scale is marked off in appropriate units-whole numbers, halves, or quarters. Write down what this means. Draw an example of it in your notebook.
Measurement Data • For the next 25 minutes you will be working with the standard from Measurement Data strand. • You will be: • Working with a partner to complete a full data process. • Creating a question • Gathering data • Representing data results • Summarizing your data – asking questions
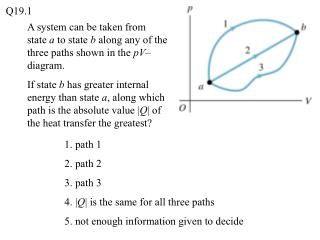
Which of these is not a unit of measurement? • A Barn • An Outhouse • A Garage • A Shed
A barn (symbol b) is a unit of area. Originally used in nuclear physics for expressing the cross sectional area of nuclei and nuclear reactions, today it is used in all fields of high energy physics to express the cross sections of any scattering process, and is best understood as a measure of the probability of interaction between small particles • A Barn = 10−28 m2 • An Outhouse = 10−34 m2 • A Garage • A Shed = 10−52 m2
How long is a twinkling of the eye? • 1 second • 160 milliseconds • 1/100 of a millisecond • An eon
In medieval time, the Latin “Atomus”meant "a twinkling of the eye," the smallest amount of time imaginable. Nowadays, it’s defined as 1/376 minute or about 160 milliseconds. • 1 second • 160 milliseconds • 1/100 of a millisecond • An eon
How much is a smidgen? • ½ of a pinch • 2/3 of a taste • ¾ of a dash • 2 squirts
How much is a smidgen? • ½ of a pinch • 2/3 of a taste • ¾ of a dash • 2 squirts
How long is a smoot? • 13 yards • 555 years • 3 Scovilles • 1.7 meters
One Smoot is defined as 5’ 7” (1.7 m), the height of Oliver R. Smoot, then an MIT undergrad who, during his fraternity pledge, was used by his fraternity brothers to measure the length of the Harvard Bridge between Boston and Cambridge, Massachusetts. They simply laid him down on the bridge and drew a mark where his head was, repeated the entire exercise along the bridge, and got a value of 364.4 Smoots plus or minus one ear. • 13 yards • 555 years • 3 Scovilles • 1.7 meters
Taking a Survey • What are some things we could measure given the tools available?
Connecting to the Standards for Mathematical Practice • Consider the data exploration you did tonight, select one standard for mathematical practice and identify how your data experience helped to develop that standard. • What would you collect evidence one you were meeting or working on that standard?
Student Considerations • Read the description of your student and identify:
For all of the students • Would they profit from the teacher modeling his/her thinking and planning in each part of the process? • Would they profit from careful attention to vocabulary? • Would they profit from checklists? • Would they profit from strategy posters?
Binder ProjectPart B: Lesson and Reflection • Read the entire project on pgs. 5-6 in your syllabus • You have done the first draft of Reflection on Your Own Learning (Part A) • Lesson and Reflection (Part B) is due March 6 • Turn and talk about what is involved in this part
Binder ProjectPart B: Lesson and Reflection • Plan and teach a lesson based on one of the activities presented in class • Use the Alliance Lesson Plan Format • Collect student work that demonstrates representative samples of the range of understandings/misconceptions in your class • Turn in the plan, the student work, and a reflection on the student work • Reflection format to be distributed in class
Reflection Guide:Your reflection should address • What you were thinking about in developing the plan • Mathematical understandings • Your students • How you incorporated what we have done/learned in class • How the student work reflects your learning intention • Strengths and areas you could improve upon in your lesson • Include teaching and any supports you provided
If you cannot teach the lesson by March 6… • Turn in the plan and a description of the student work you will collect • Keep a copy of the plan • Identify the date you will turn in the rest of Part B • Turn in the student work and the reflection once you have taught the lesson
Grading Criteria • All components of the lesson plan format are thoughtfully addressed • Lesson incorporates what has been presented in this class • Student work is labeled and represents a range of understandings • Reflection addresses all required areas • Reflection shows evidence of application of what you have learned in class to your own teaching and your students’ learning
Intervention Projects • Look at criteria/expectations • Read your feedback in light of the expectations • How specific and focused was I? • How informative was my data? • How did I use my data?