Download
1 / 23
240 likes | 634 Views
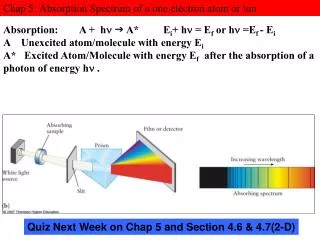
Absorption Spectrum of a Conjugated Dye. Dye Characteristics. Absorption occurs in the visible region of the spectrum Absorption intensities are very high Usually organic molecules Absorption frequencies are dependent on the length of the conjugated system. Characteristics of Spectra.

E N D
Dye Characteristics • Absorption occurs in the visible region of the spectrum • Absorption intensities are very high • Usually organic molecules • Absorption frequencies are dependent on the length of the conjugated system
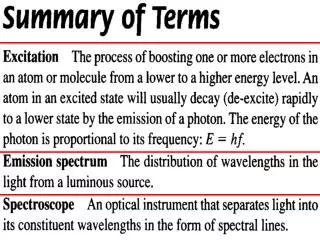
Characteristics of Spectra • Transition energy • Bohr frequency condition: • Hυ = E2 – E1 • Transition intensity • Transition moment • (μx)mn = < Ψn| ex | Ψm > • Transition length • (x)mn = < Ψn| x | Ψm >
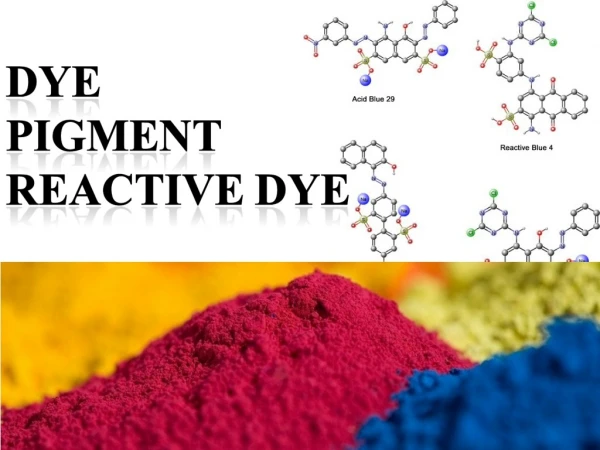
Typical Dyes CH3— ( CH == CH)n — CH3
Transition Strength Dnm= < Ψn| x2 + y2 + z2 | Ψm > Where the dimensions of D are cm2 and the frequency is in wavenumbers. The above equation is for a solution. A symmetric Gaussian-shaped band allows the integral to be estimated by: Where h is the half-width of the band at its half-height (in wavenumbers).
The dye molecule’s conjugated system of length L may be represented by the Particle in a Box model potential with solution: Where the absorption excites the molecule from the energy state E1 to the excited energy state E2. According to the Bohr Frequency Condition then:
Where the quantum numbers for the two half-occupied orbitals involved with the transition are n2 and n1 for the excited and ground state half-occupied orbitals, respectively. This gives a transition energy of: There are N electrons in the π system so now the energy is:
Spectrophotometer spectra are usually produced as a function of wavelength so since: We can write: The number of carbon atoms in the box is p = N – 3 which affords an easy expression for the conjugation length, L, in terms of the bond length, l:
So the wavelength of the absorption may now be expressed as: And with substitution of the appropriate values for the constants: Different dyes have different end groups of different polarizability, and this leads to the final expression:
I I I - dI I Experimental Procedure • Lambert-Beer Law I I Sample of concentration c and cell of pathlength d
Safety • Dyes can be toxic and some have been associated with carcinogenicity. • Wear gloves in handling the dyes and their solutions. • Immediately wash any contact with the dyes or their solutions with soap and water.
Prepare a 10 ml sample of your assigned dye(s) with an approximate concentration of 1.0 x 10⁻³ M by dissolving 3-5 mg of the dye in methanol. Some solutions may already be prepared. • Use the spectrophotometer to obtain a solution spectrum over the visible range (400-800 nm). • You may need to dilute the solution to insure that the absorbance reading at the maximum wave-length does not exceed 1.0 (10% transmittance). • At high concentrations of dye, dimerization may occur which could alter the spectrum. For sufficiently dilute solutions, dimerization does not contribute to the spectrum.
Calculations • Plot spectra and decompose bands to obtain the peak wavelength of absorption for each dye. • Using the appropriate equation, calculate the peak wavelength of absorption for each dye. • 1. Using the longest λmax calculate ΔEexp for each dye and the 95% confidence limits. (Note: The 95% confidence limits of λmax may be taken as ± 1 nm.) • 2. Use PIB equation to calculate ΔEtheo for each compound. Compare the result to the experimental value. • 3. For each set of dyes use an iterative method to calculate the best-fit. Recalculate ΔEtheo for each dye, and compare the results to the experimental values.
The sum should be minimized for obtaining the best-fit in a regression analysis. • Choose the best value of α ( how can you use a least squares fit of the data?). • Use the Hückel Approximation to calculate the best value of the exchange integral for the dye series. Again, a regression analysis should be considered.